1. WHAT IS REVO GENIUS? 2. REQUIREMENTS 3. REVO GENIUS BACK-OFFICE 3.1 DASHBOARD 3.2 SALES 3.3 EMPLOYEES 3.4 PAYMENTS 3.5 CANCELLATIONS 3.6 DISCOUNTS 3.7 TIPS 3.8 DELIVERY
1. WHAT IS REVO GENIUS?
Every day, your business generates a lot of valuable information. However, this information remains hidden if you don't have optimal tools to analyse it in depth.
Revo GENIUS collects data from REVO and other sources and analyses it so you can manage your business even better.
More information here.
2. REQUIREMENTS
-
Have a Google account (Gmail).
-
Each Gmail account can view the Revo XEF accounts it has configured.
-
Only available for Revo XEF.
3. REVO GENIUS BACK-OFFICE
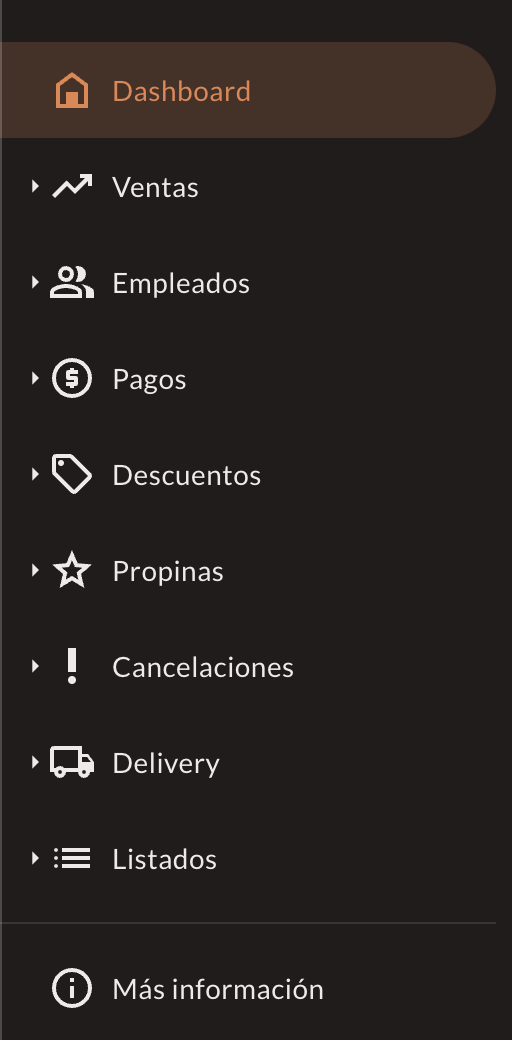
On the left, you will find the sidebar where you can select the different reports.
3.1 DASHBOARD
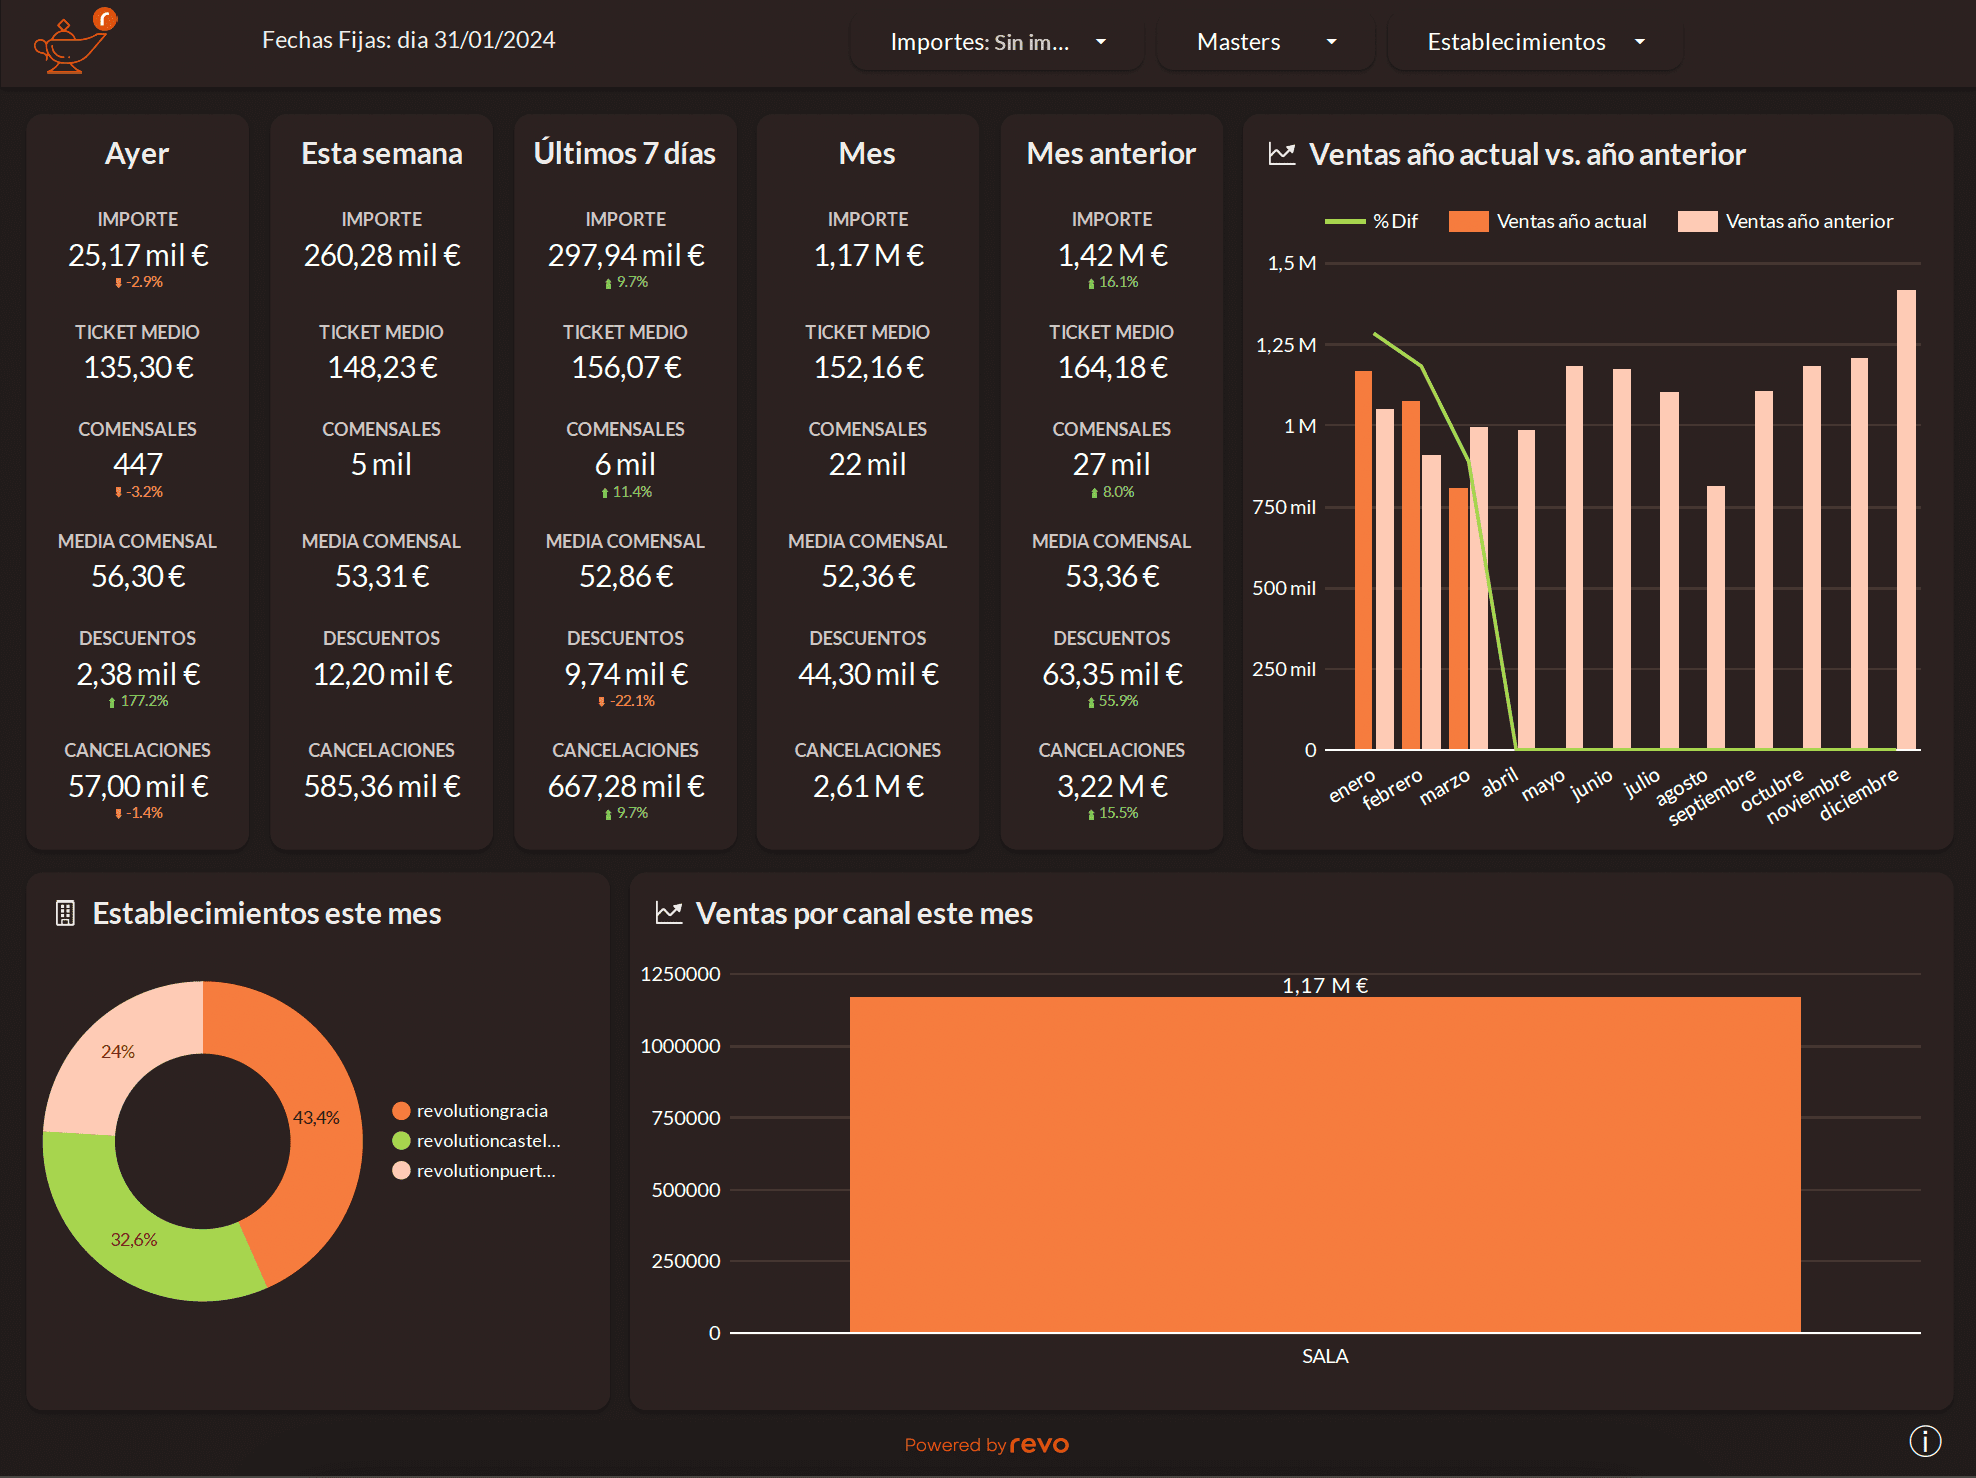
Here you will find the general information about your business. Here we have four filters:
- Amounts: We can choose whether to view them with or without VAT.
- Masters: We can choose, if we have several Master accounts, which one to display.
- Establishments: We can select to view a particular establishment.
- Date: We can select the date range to view the information.
These filters will be found in all sections.
We will see the information separated by: yesterday, week, last 7 days, month, and previous month, allowing us to see variations at a glance. It also shows if there is an increase or decrease, which is obtained by comparing these data with the previous period, to give us an idea of how our business is progressing.
We also have several charts for a quick view of our sales:
- Difference between this year's sales and last year's.
- Difference between current month sales among different establishments.
- Current month sales by different channels (in-store sales, delivery services, etc.).
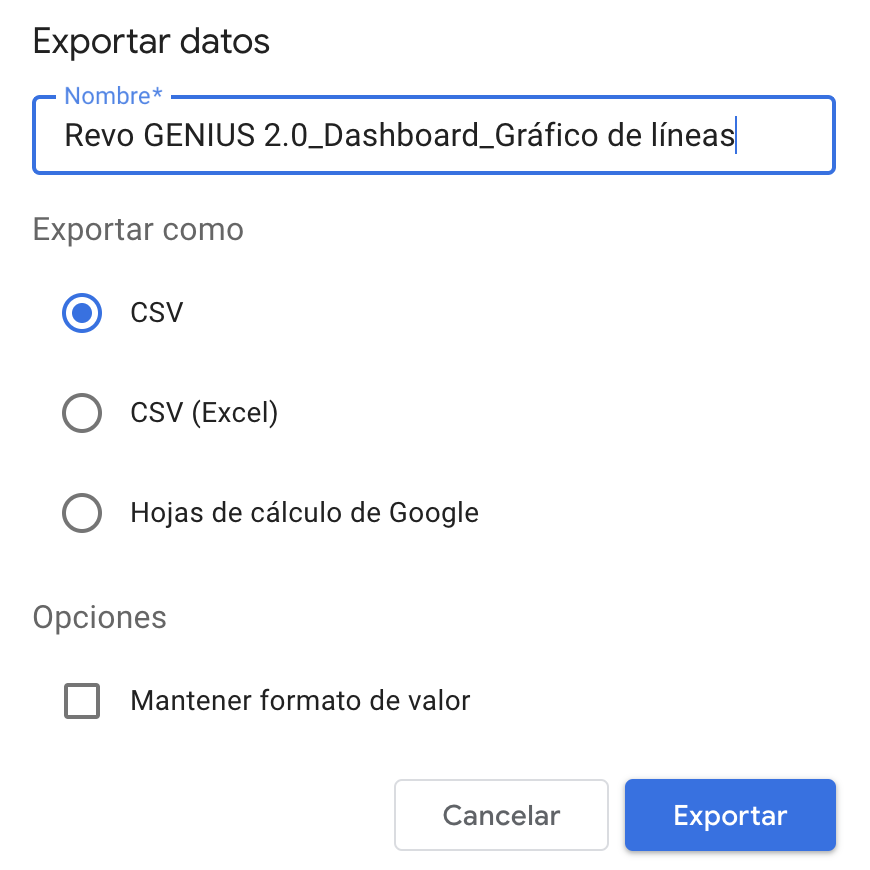
All charts and reports can be exported by right-clicking on them, a window will open where you can choose the format and enter a name. Then click on Export.
3.2 SALES
The sales section consists of 5 sections, where you can obtain sales values broken down in different ways:
Orders
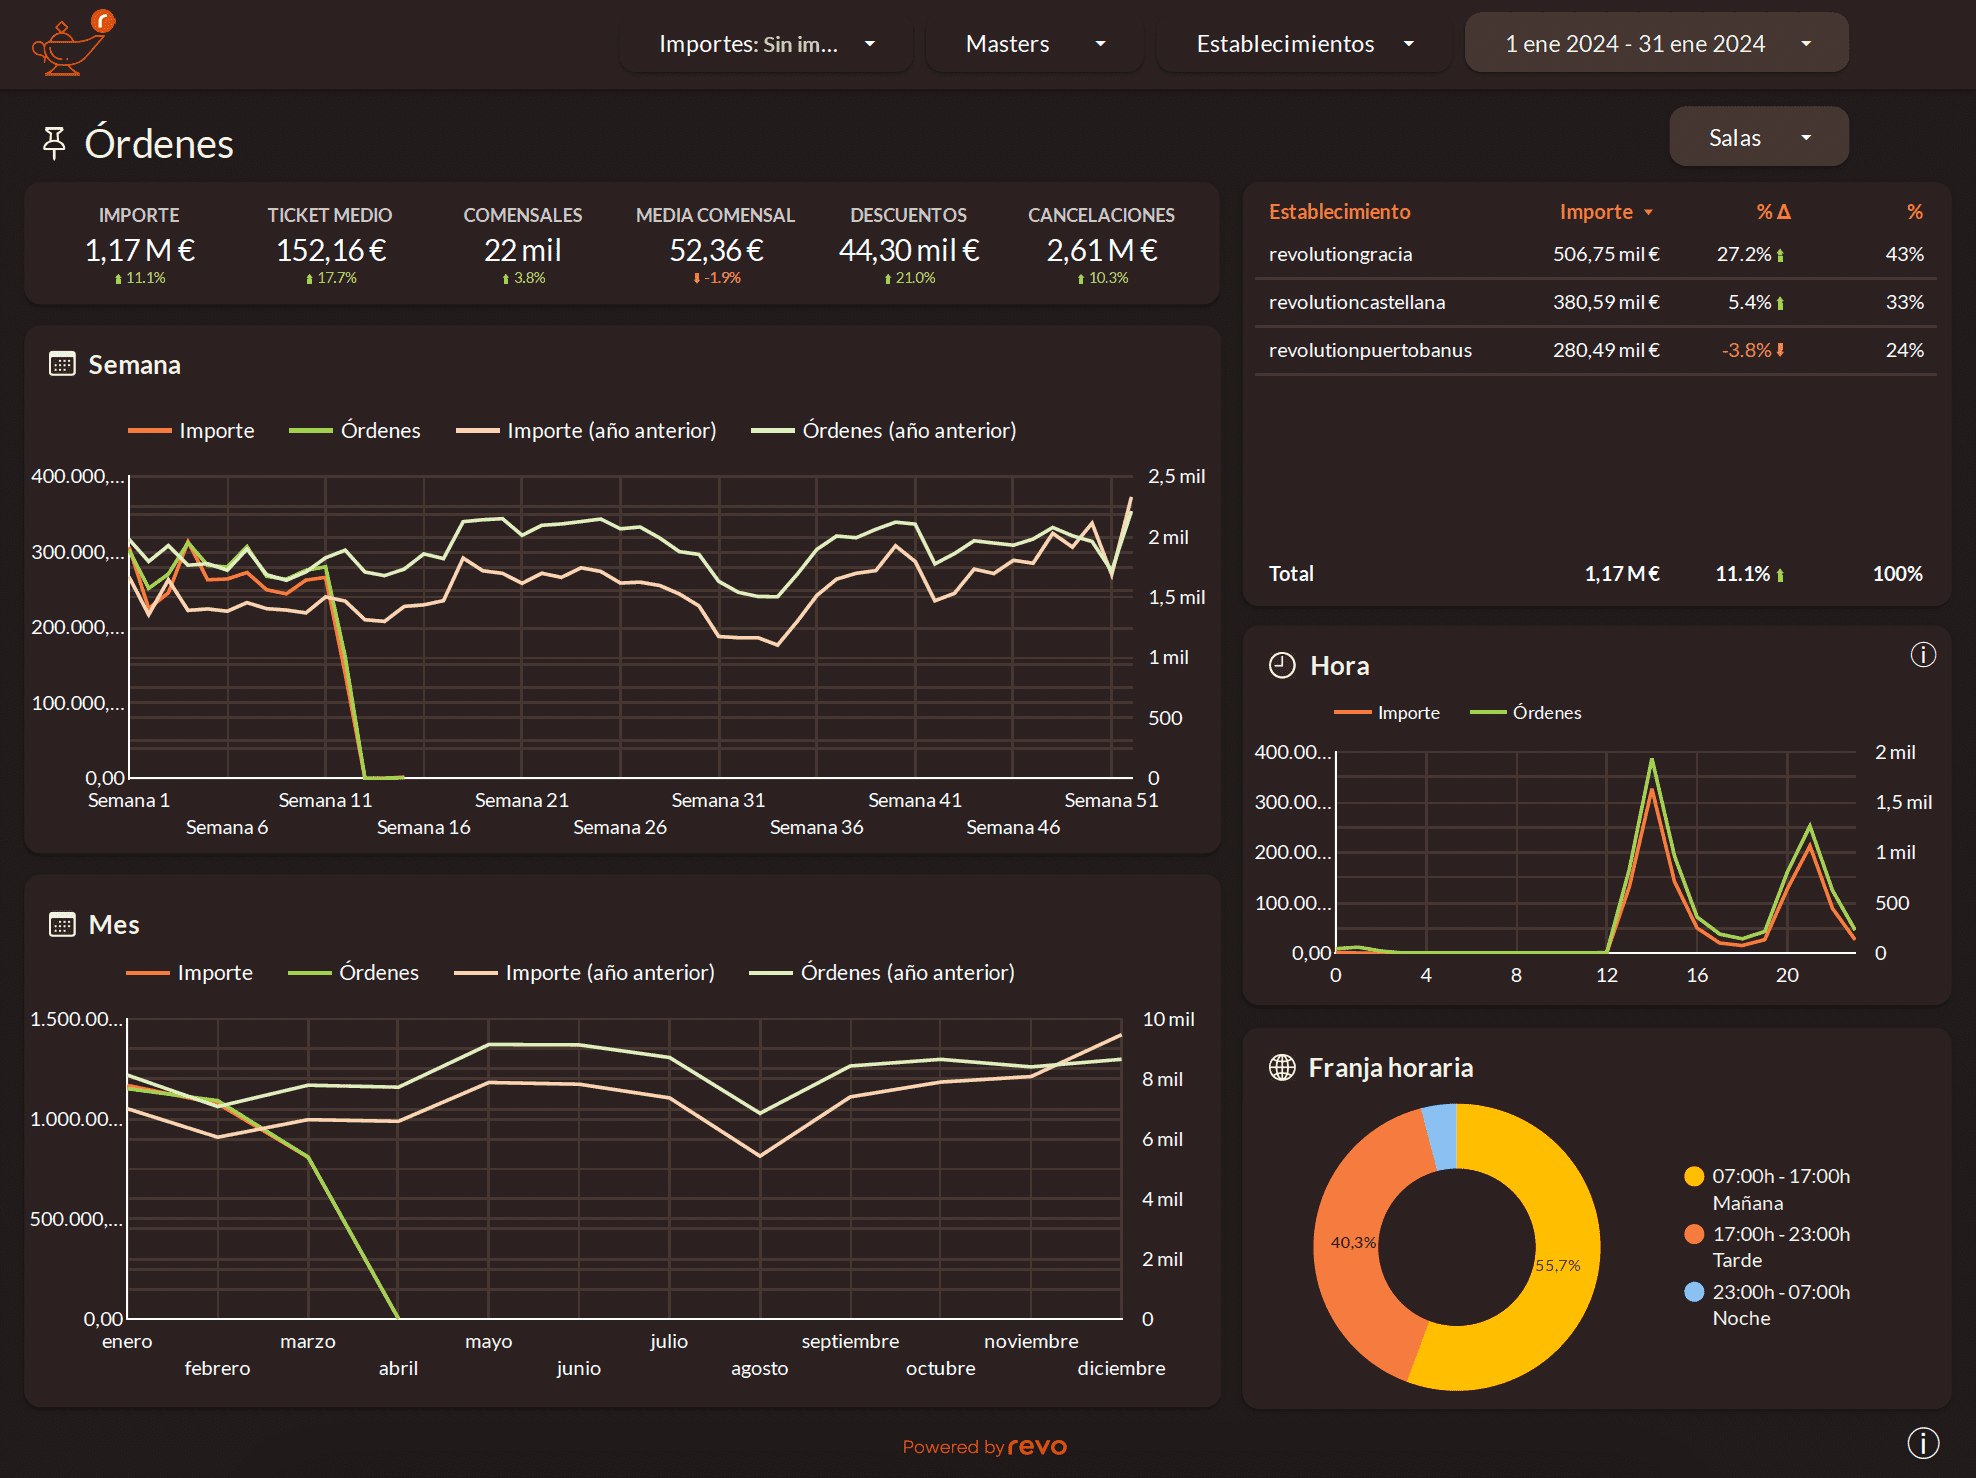
In addition to the filters mentioned above, here we find the Rooms filter, where we can choose to view them all or one in particular.
We can see the general information:
- Amount: Revenue obtained during the indicated date range.
- Average Ticket: Average revenue obtained per ticket.
- Guests: Flow of guests served.
- Average Guest: Average revenue per guest.
- Discounts: Value of discounts.
- Cancellations: Amount of cancellations during the date range.
We can see the information broken down by establishments:
- Establishment: Here all the establishments associated with us will appear.
- Amount: Breaks down the previous amount by establishments.
- : Compares the current revenue value with that of the previous year. Showing the result as a percentage.
- : Percentage of revenue per establishment.
We see how the charts break down the amounts and orders by time slot, hour, week, and month.
Categories / Groups
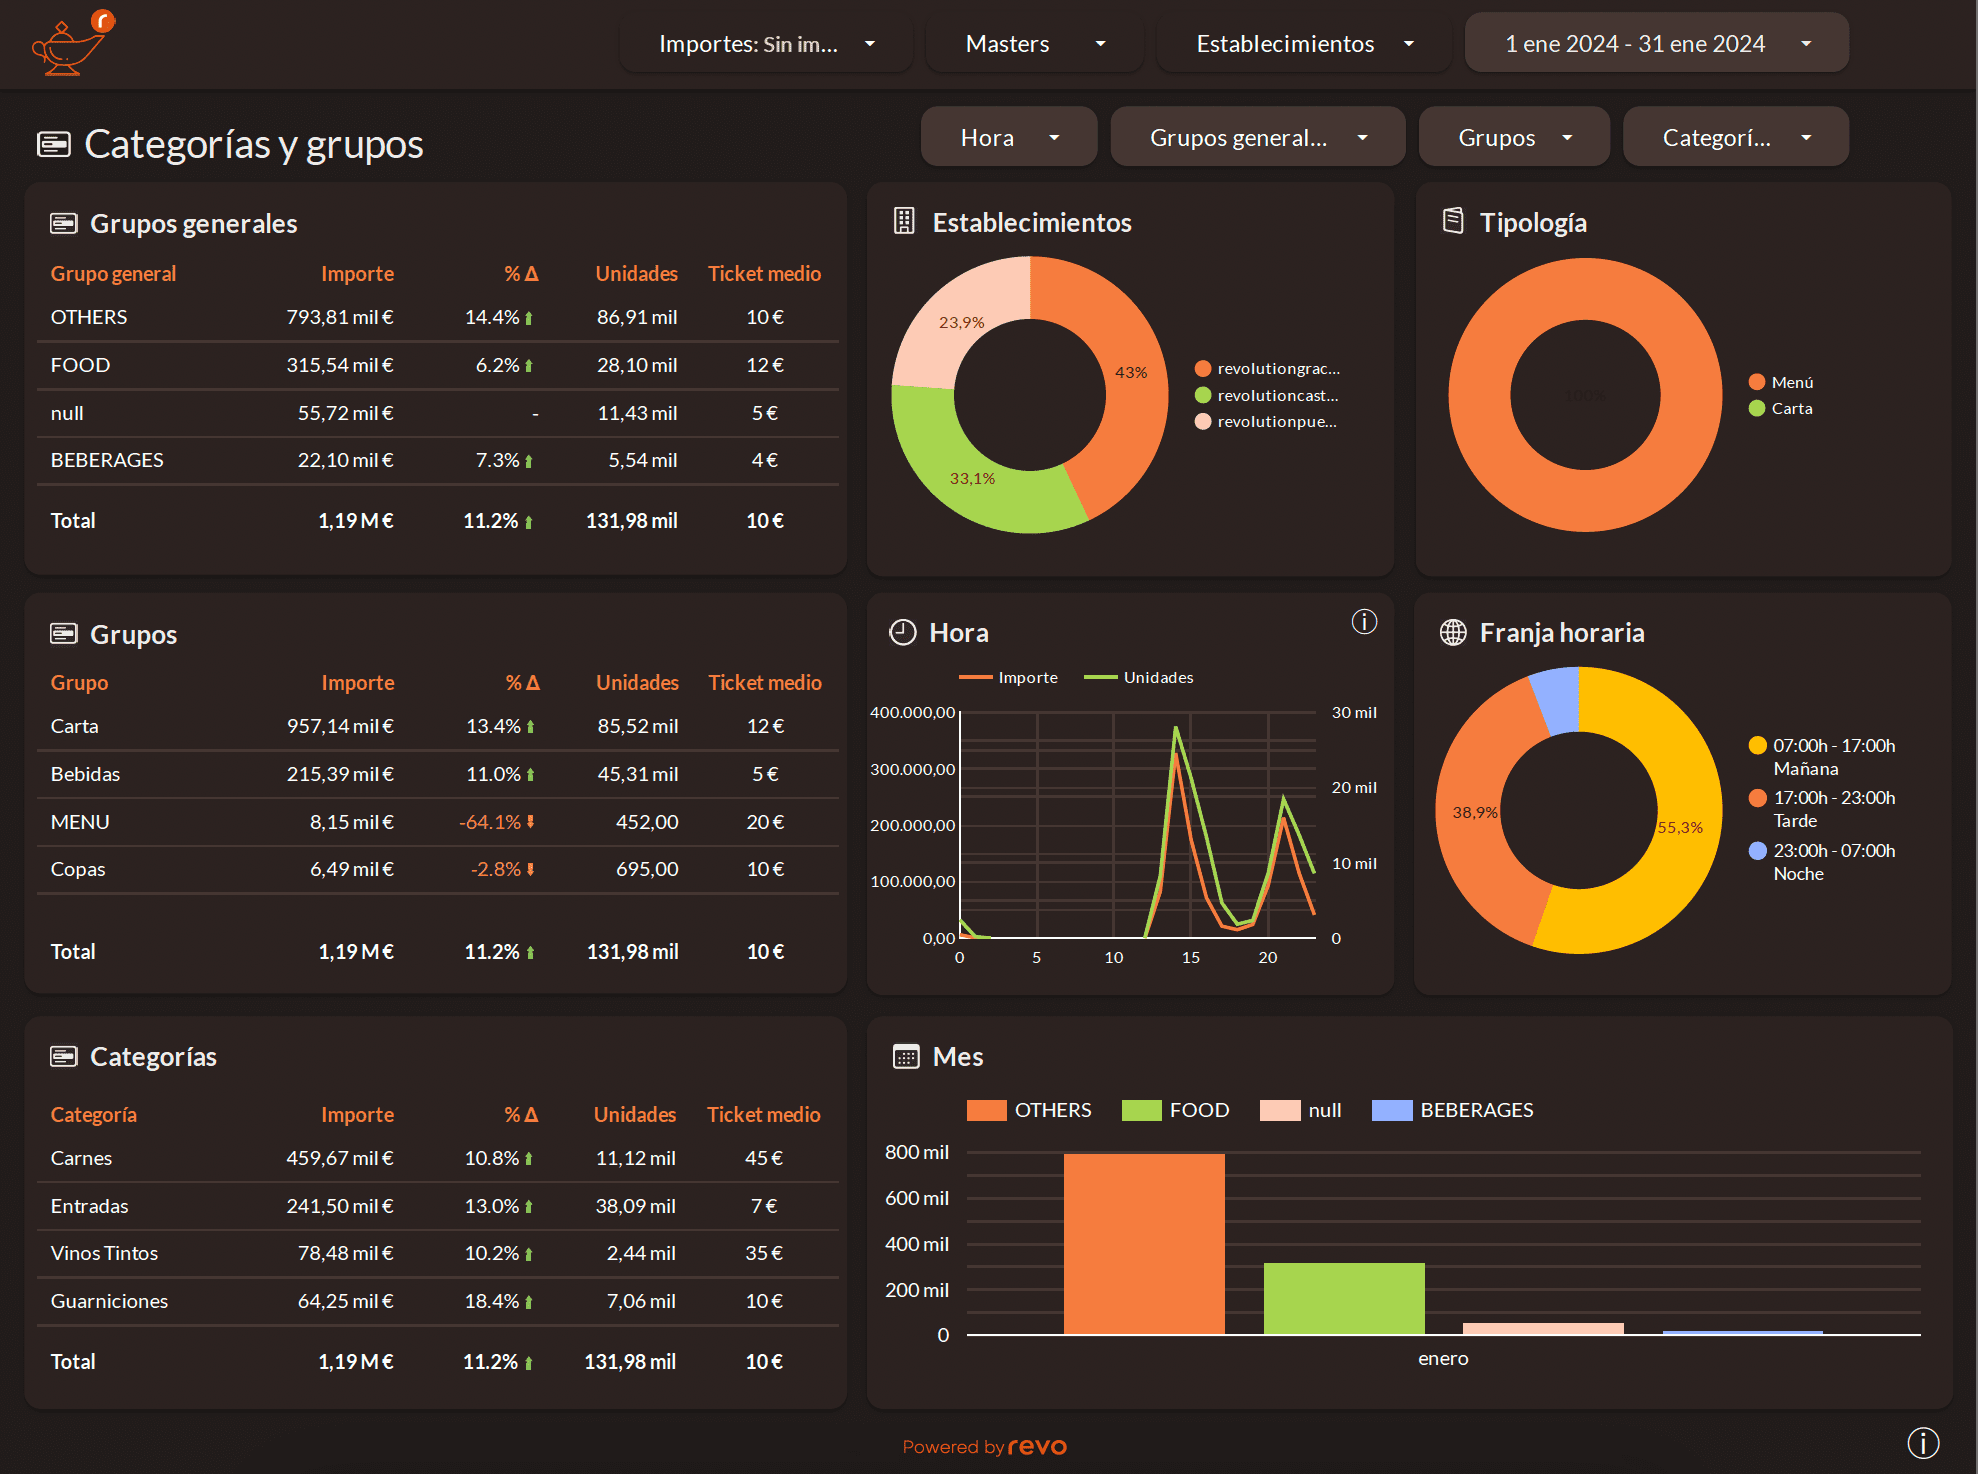
Here are the available filters:
- Time: You can select the time (in 24h format) to visualize.
- General Groups: You can choose which general group to visualize. These are the General Groups created in the Revo XEF back-office.
- Groups: You can choose which group or groups to visualize. These are the Groups created in the Revo XEF back-office.
- Category: You can choose which category or categories to visualize. These are the Categories created in the Revo XEF back-office.
We have detailed information in three tables: General Groups, Groups, and Categories.
- General Group/Group/Category: Shows the general groups, groups, or categories.
- Amount: You can see the earnings obtained.
- : Compares the value of current revenues with those of the previous year. Displays the result in percentage.
- Units: Shows the number of units sold.
- Average Ticket: Average earnings obtained per ticket.
Graphs:
- Establishments: Displays the amount obtained separately for the establishments you have added.
- Typology: Visually shows the different types of products. For example, if it's a menu, à la carte, etc.
- Time Slot and Time: Breaks down the amounts and orders.
- Month: Shows the earnings of the general groups.
Products
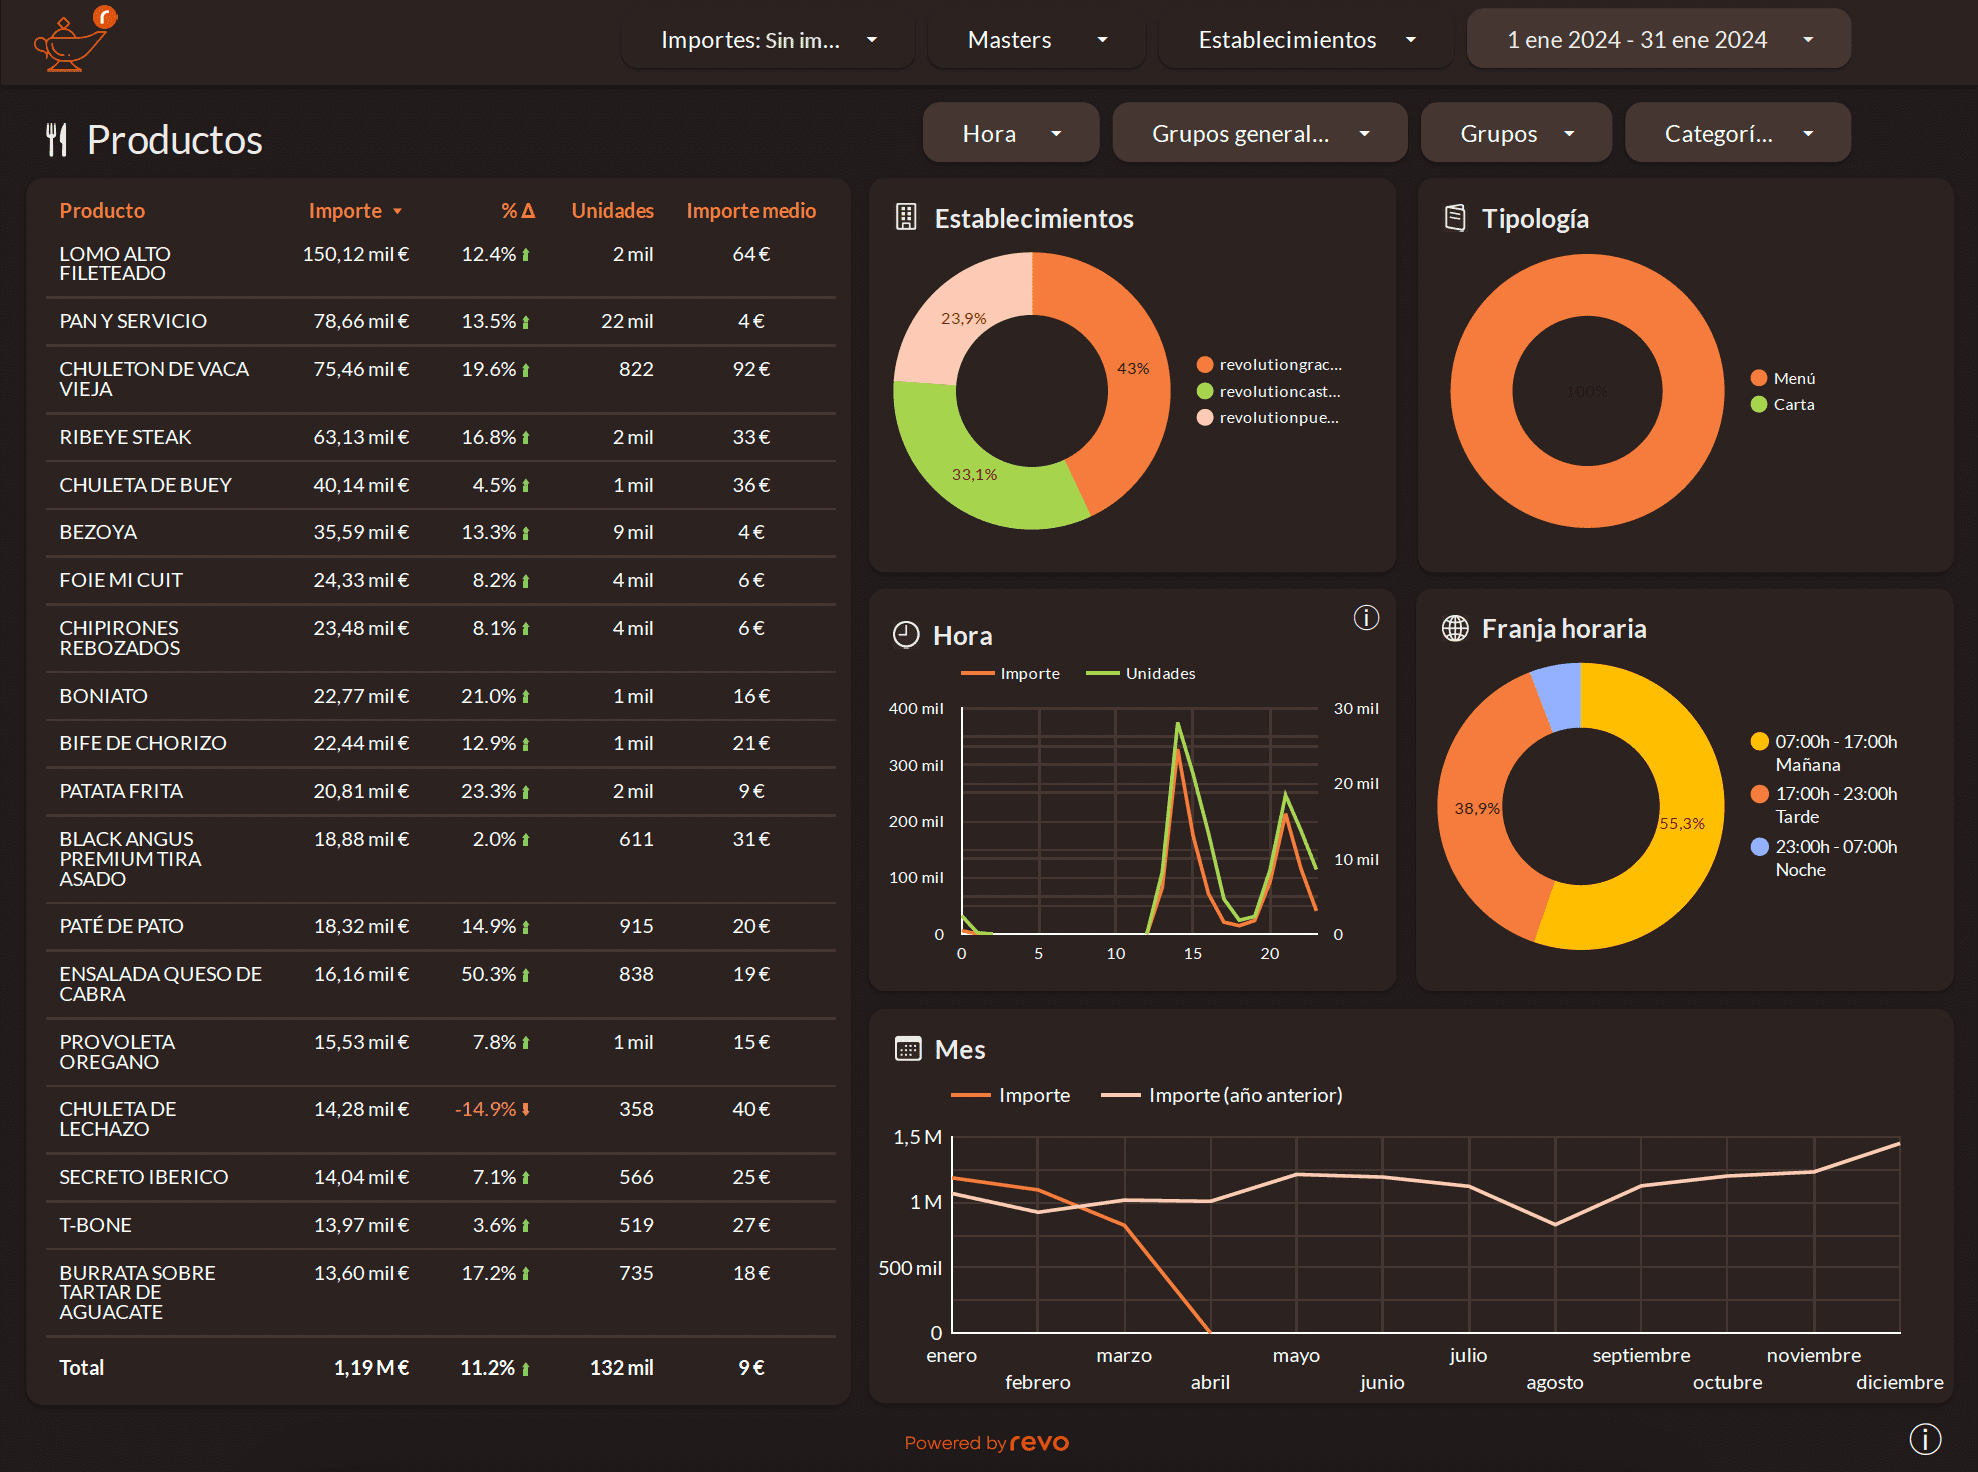
Here are the available filters:
- Time: You can select the time (in 24h format) to visualize.
- General Groups: You can choose which general group to visualize. These are the General Groups created in the Revo XEF back-office.
- Groups: You can choose which group or groups to visualize. These are the Groups created in the Revo XEF back-office.
- Categories: You can choose which category or categories to visualize. These are the Categories created in the Revo XEF back-office.
We have detailed information in the Products table:
- Product: Shows the products.
- Amount: You can see the earnings obtained.
- : Compares the value of current revenues with those of the previous year. Displays the result in percentage.
- Units: Shows the number of units sold.
- Average Amount: Average earnings obtained per product.
Graphs:
- Establishments: Displays the amount obtained separately for the establishments you have added.
- Typology: Visually shows the different types of products. For example, if it's a menu, à la carte, etc.
- Time Slot and Time: Breaks down the amounts and orders.
- Month: Shows the earnings per month, comparing them with the previous year.
Product Details
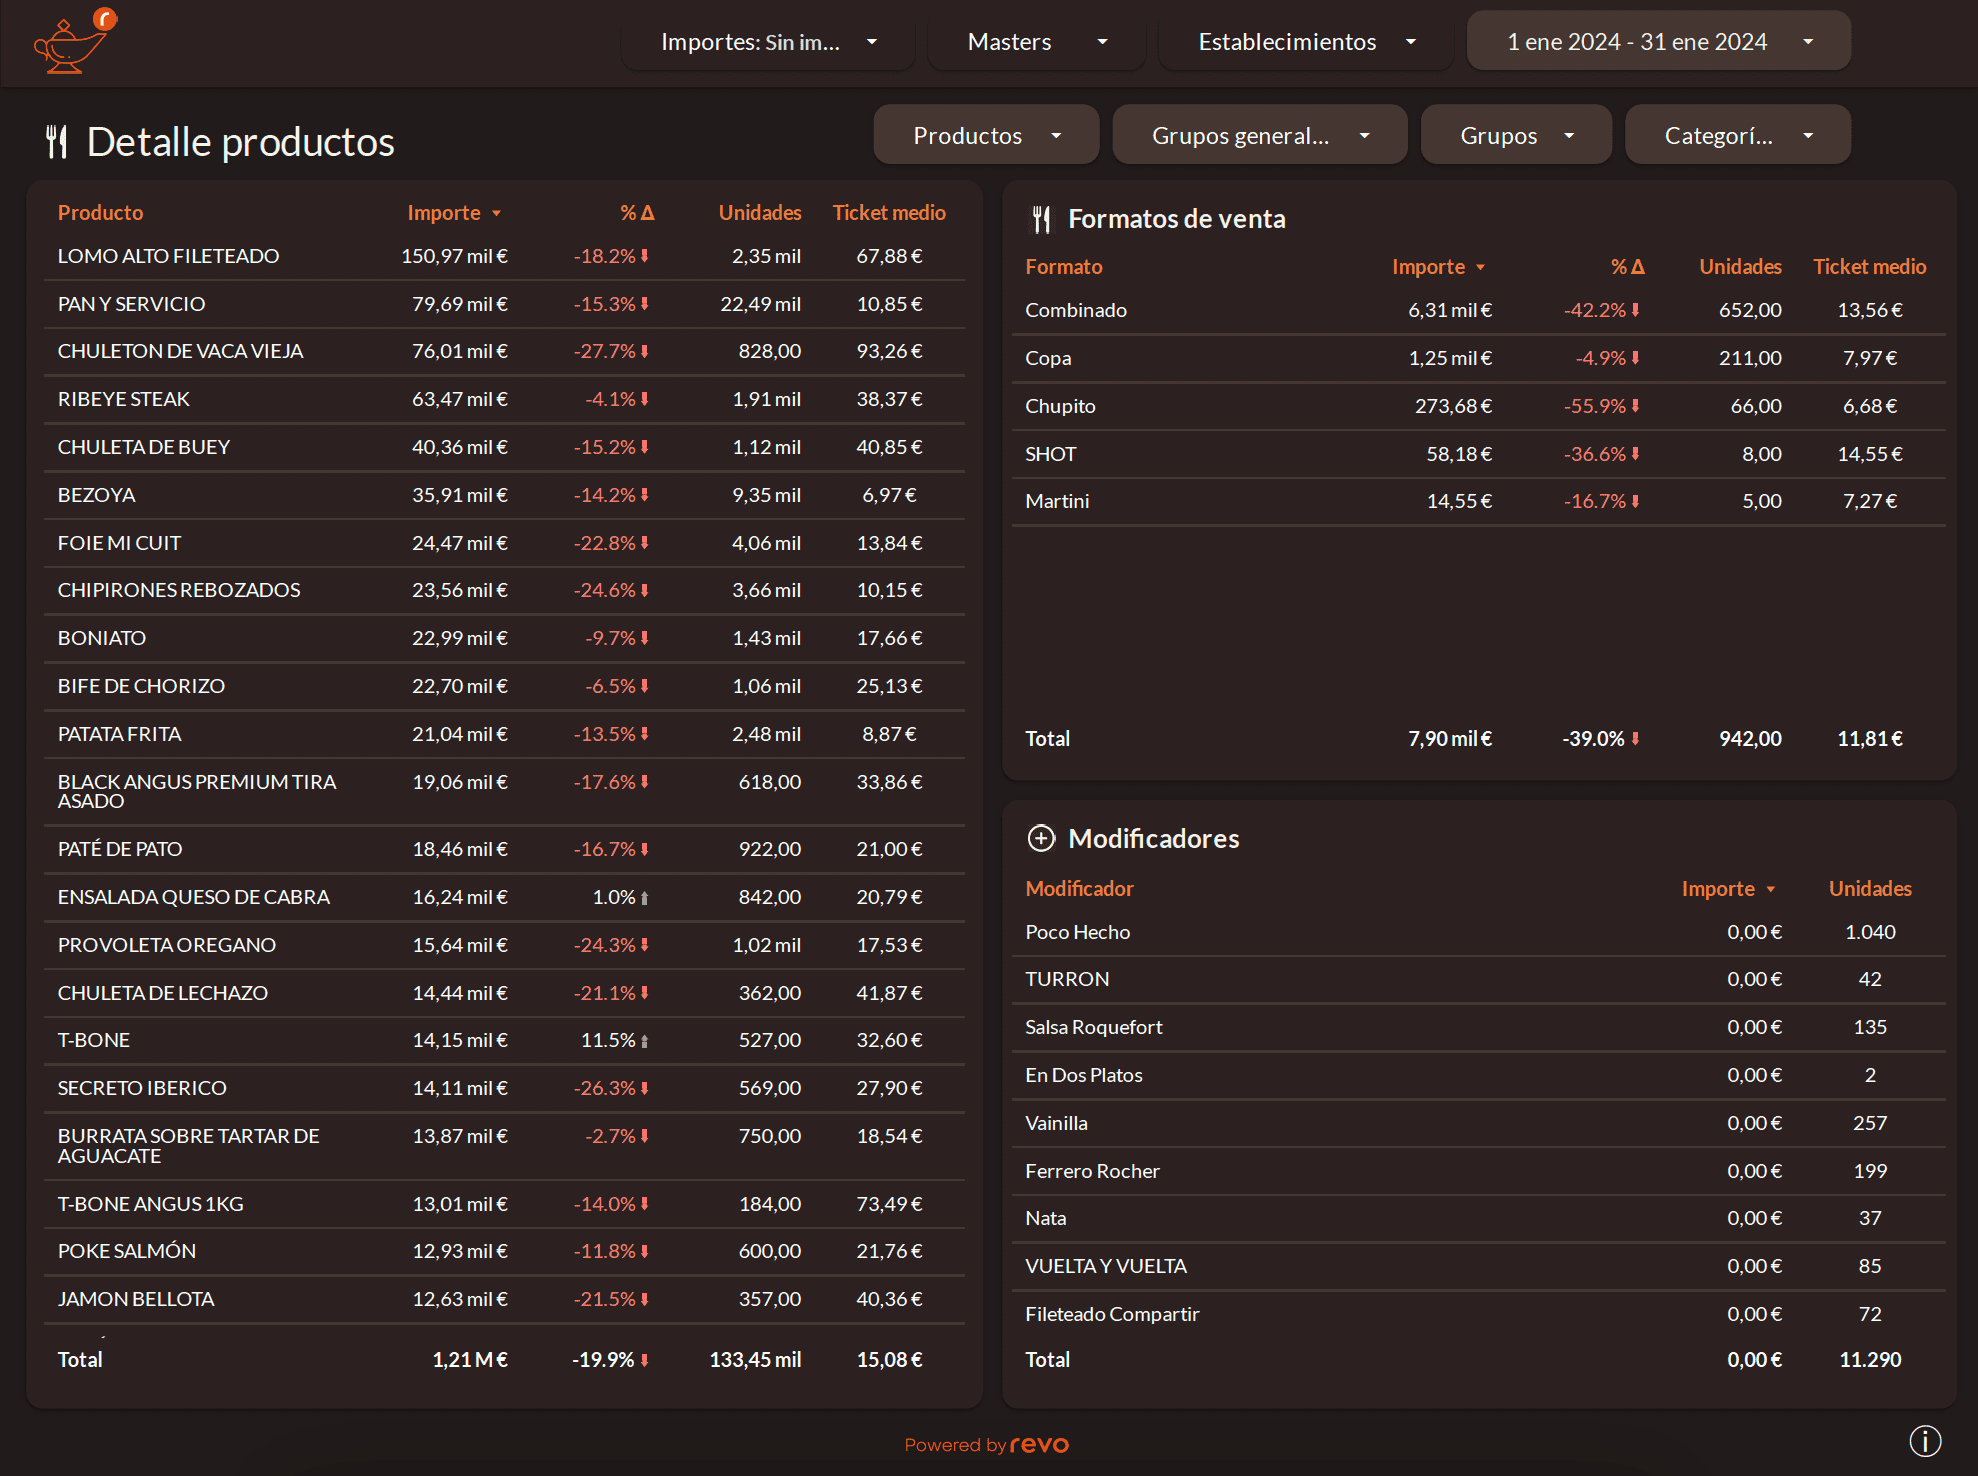
Here are the available filters:
- Time: You can select the time (in 24h format) to visualize.
- General Groups: You can choose which general group to visualize. These are the General Groups created in the Revo XEF back-office.
- Groups: You can choose which group or groups to visualize. These are the Groups created in the Revo XEF back-office.
- Categories: You can choose which category or categories to visualize. These are the Categories created in the Revo XEF back-office.
We have detailed information in three tables: Product Details, Sales Formats, and Modifiers:
- Product/Format/Modifier: Shows the products, sales formats, or modifiers.
- Amount: You can see the earnings obtained.
- : Compares the value of current revenues with those of the previous year. Displays the result in percentage.
- Units: Shows the number of units sold.
- Average Ticket: Average earnings obtained per ticket.
Rooms
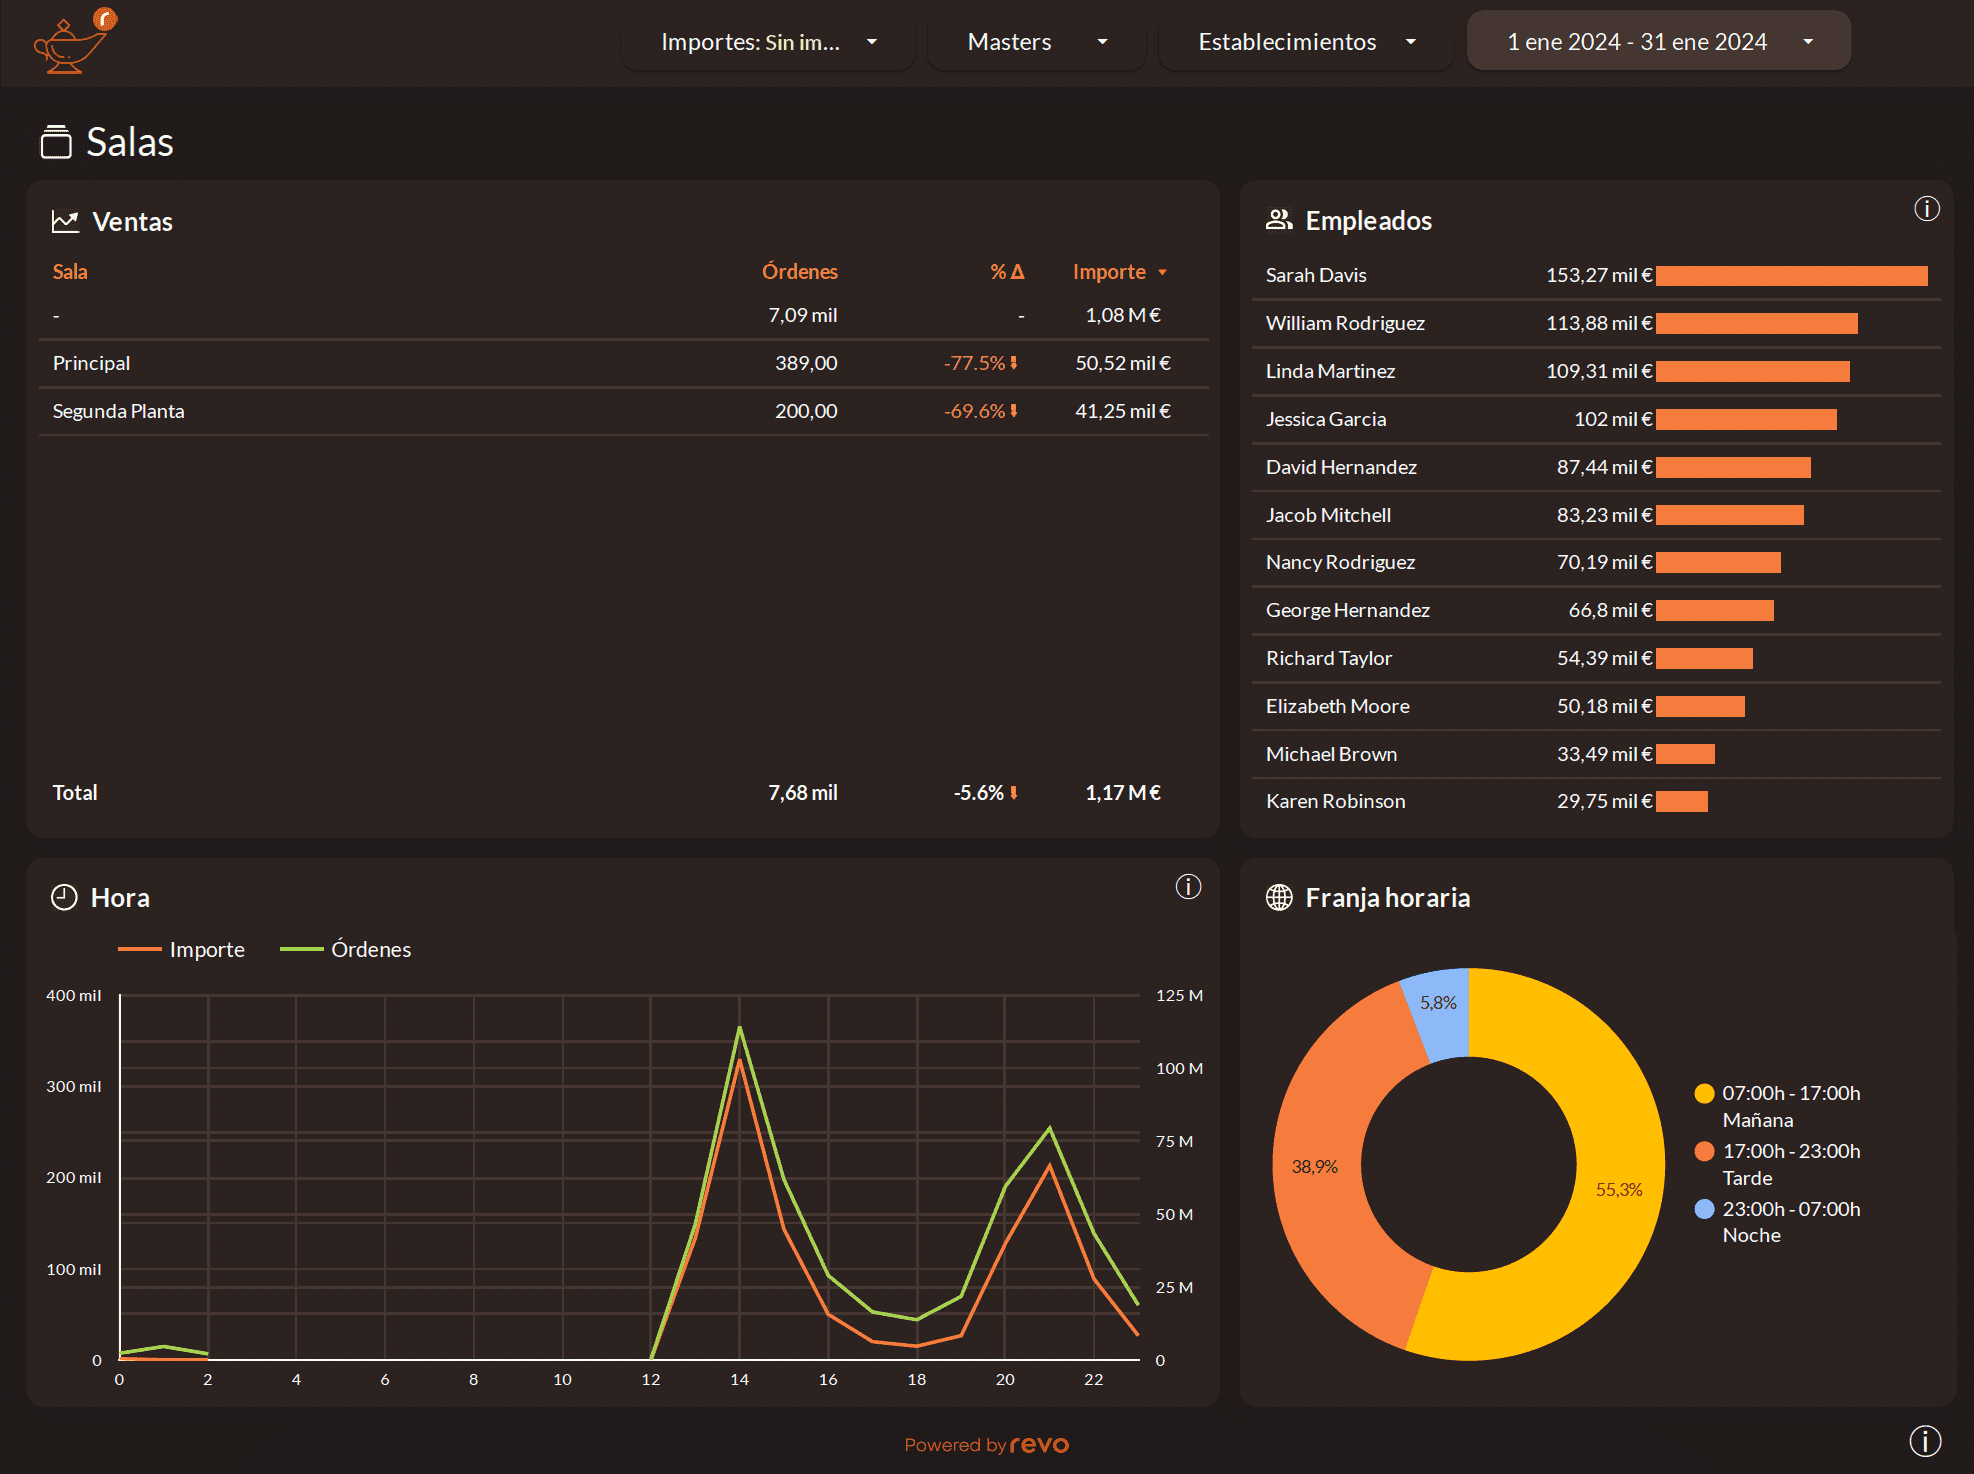
Here are the detailed information available in the Sales table:
- Room: Shows the different rooms.
- Orders: Number of orders generated per room.
- : Compares the value of current orders with those of the previous year. Displays the result in percentage.
- Amount: You can see the earnings obtained.
Graphs:
- Employees: Displays the amount obtained per employee.
- Time Slot and Time: Breaks down the amounts and orders.
3.3 EMPLOYEES
The employees section is divided into 3 parts, where you can obtain sales values broken down in different ways:
Employees
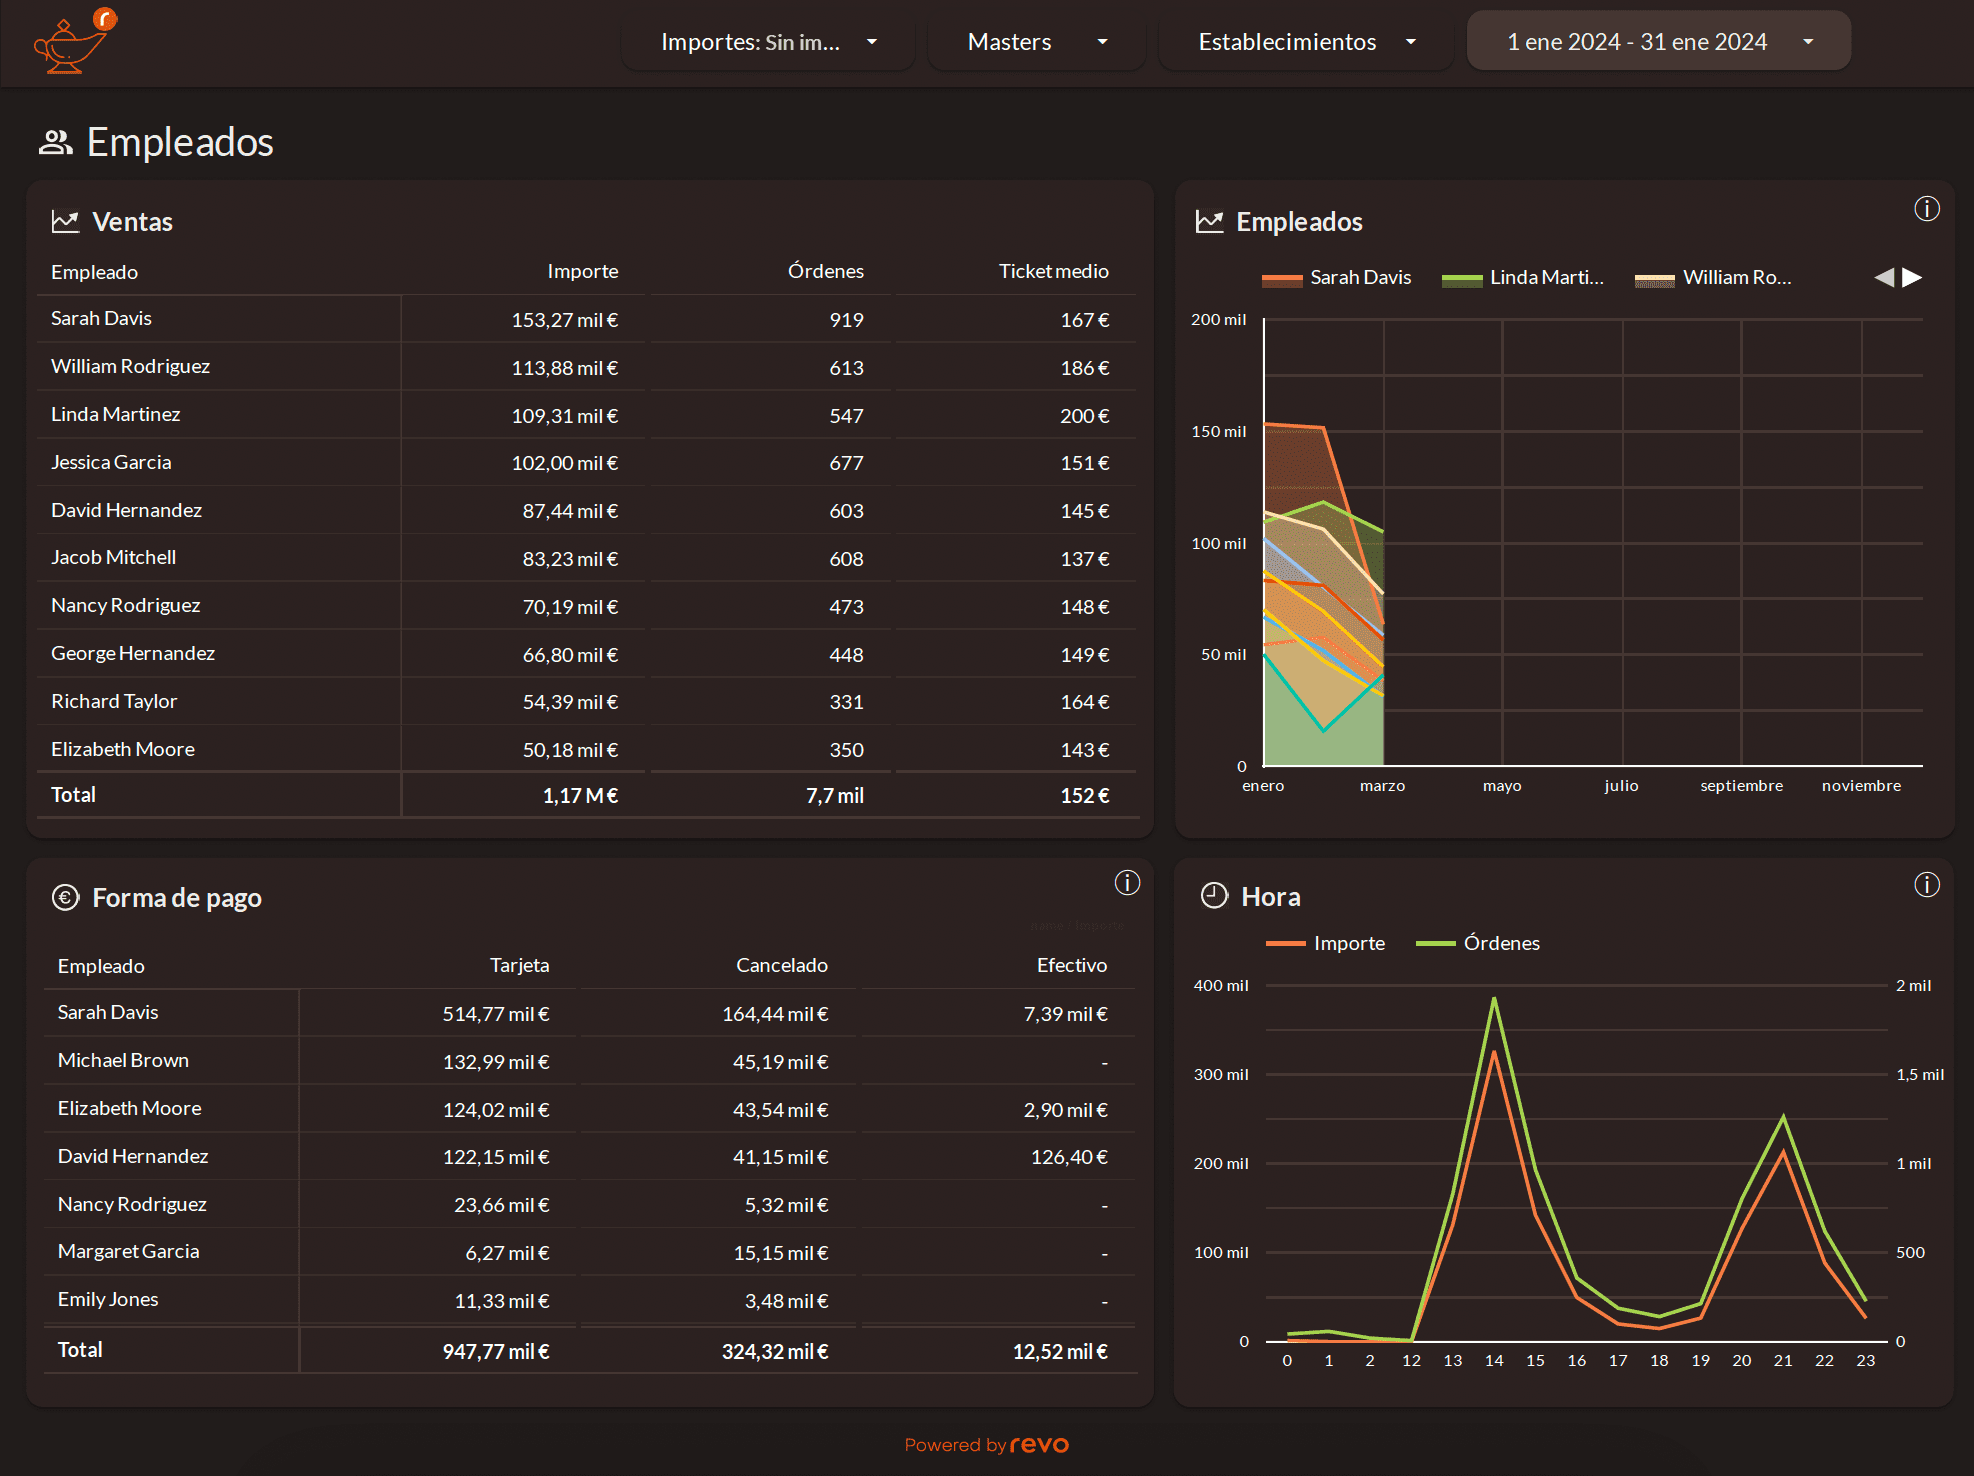
Here are the detailed information available in the tables:
Sales
- Employee: Shows the different employees.
- Amount: You can see the earnings obtained.
- Orders: Number of orders generated per employee.
- Average Ticket: Average earnings obtained per ticket.
Payment Methods
- Employee: Shows the different employees who have made the payments.
- Card: Value of earnings obtained from payments made via card.
- Cancelled: Value of losses for payments made via cancelled.
- Cash: Value of earnings obtained from payments made via cash.
If you have more payment methods, they will appear in the list.
Graphs:
- Employees: Displays the amount obtained per employee.
- Time: Breaks down the amounts and orders.
Products
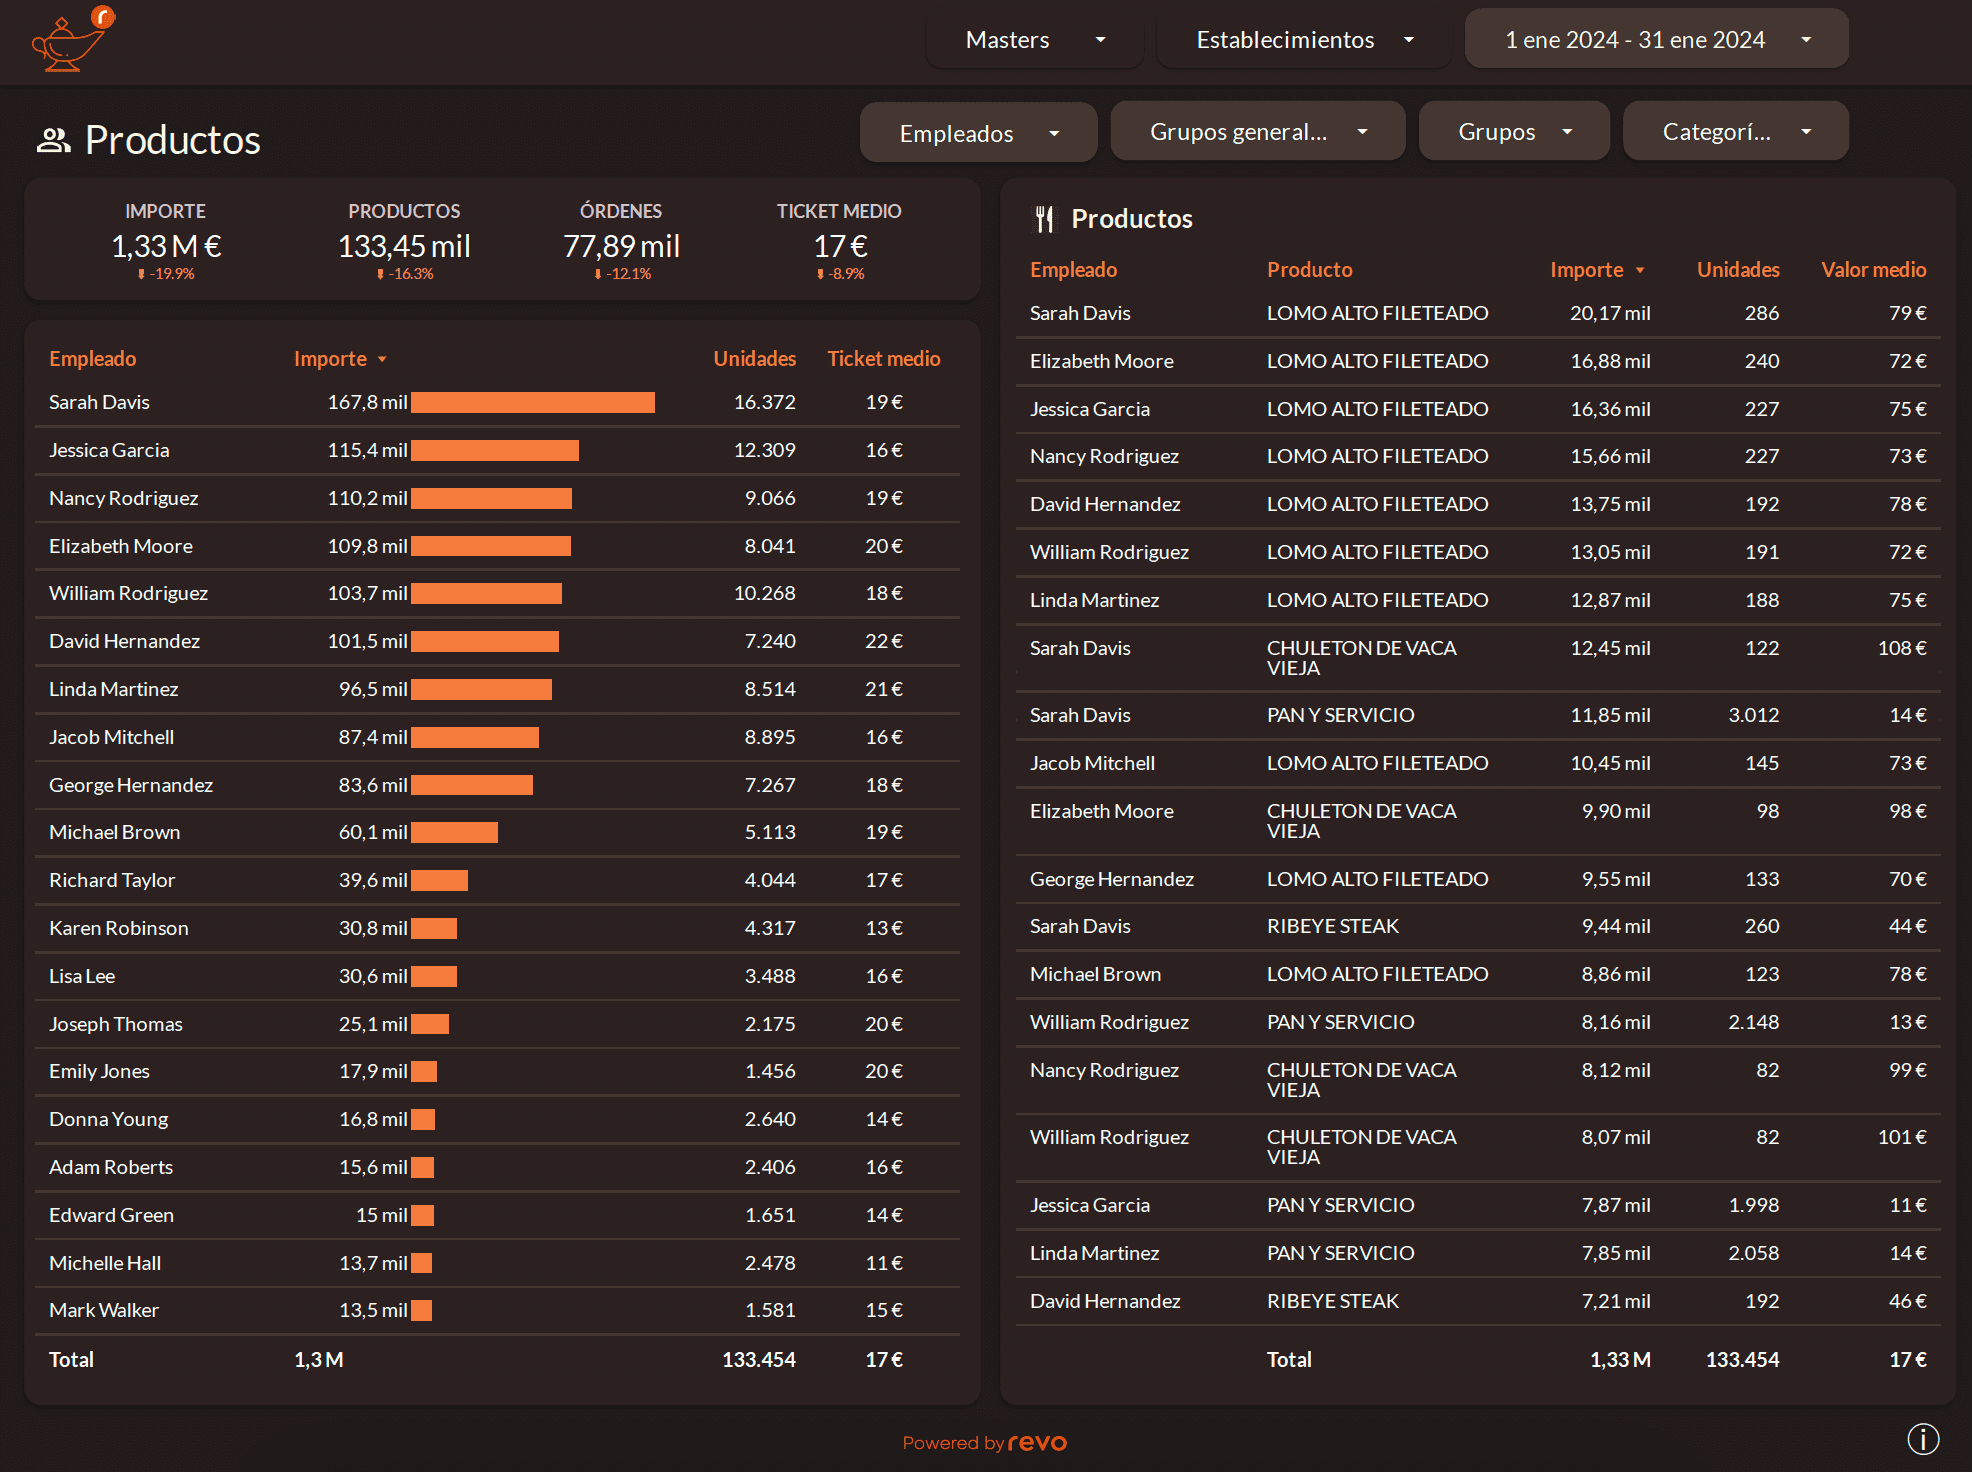
Here are the available filters:
- Employee: We can select the employee to visualize.
- General groups: We can choose which supergroup to visualize. These are the General Groups created in the Revo XEF back-office.
- Groups: We can choose which group or groups to visualize. These are the Groups created in the Revo XEF back-office.
- Categories: We can choose which category or categories to visualize. These are the Categories created in the Revo XEF back-office.
Products
- Employee: It shows us the employees.
- Product: It shows us the product sold by the employee.
- Amount: We can see the earnings obtained.
- Units: Displays the number of units sold.
- Average value: Average of earnings obtained per product.
Employee
- Employee: It shows us the employees.
- Amount: We can see the earnings obtained by the employee.
- Units: Displays the number of units sold.
- Average ticket: Average of earnings obtained per ticket.
Employee Details
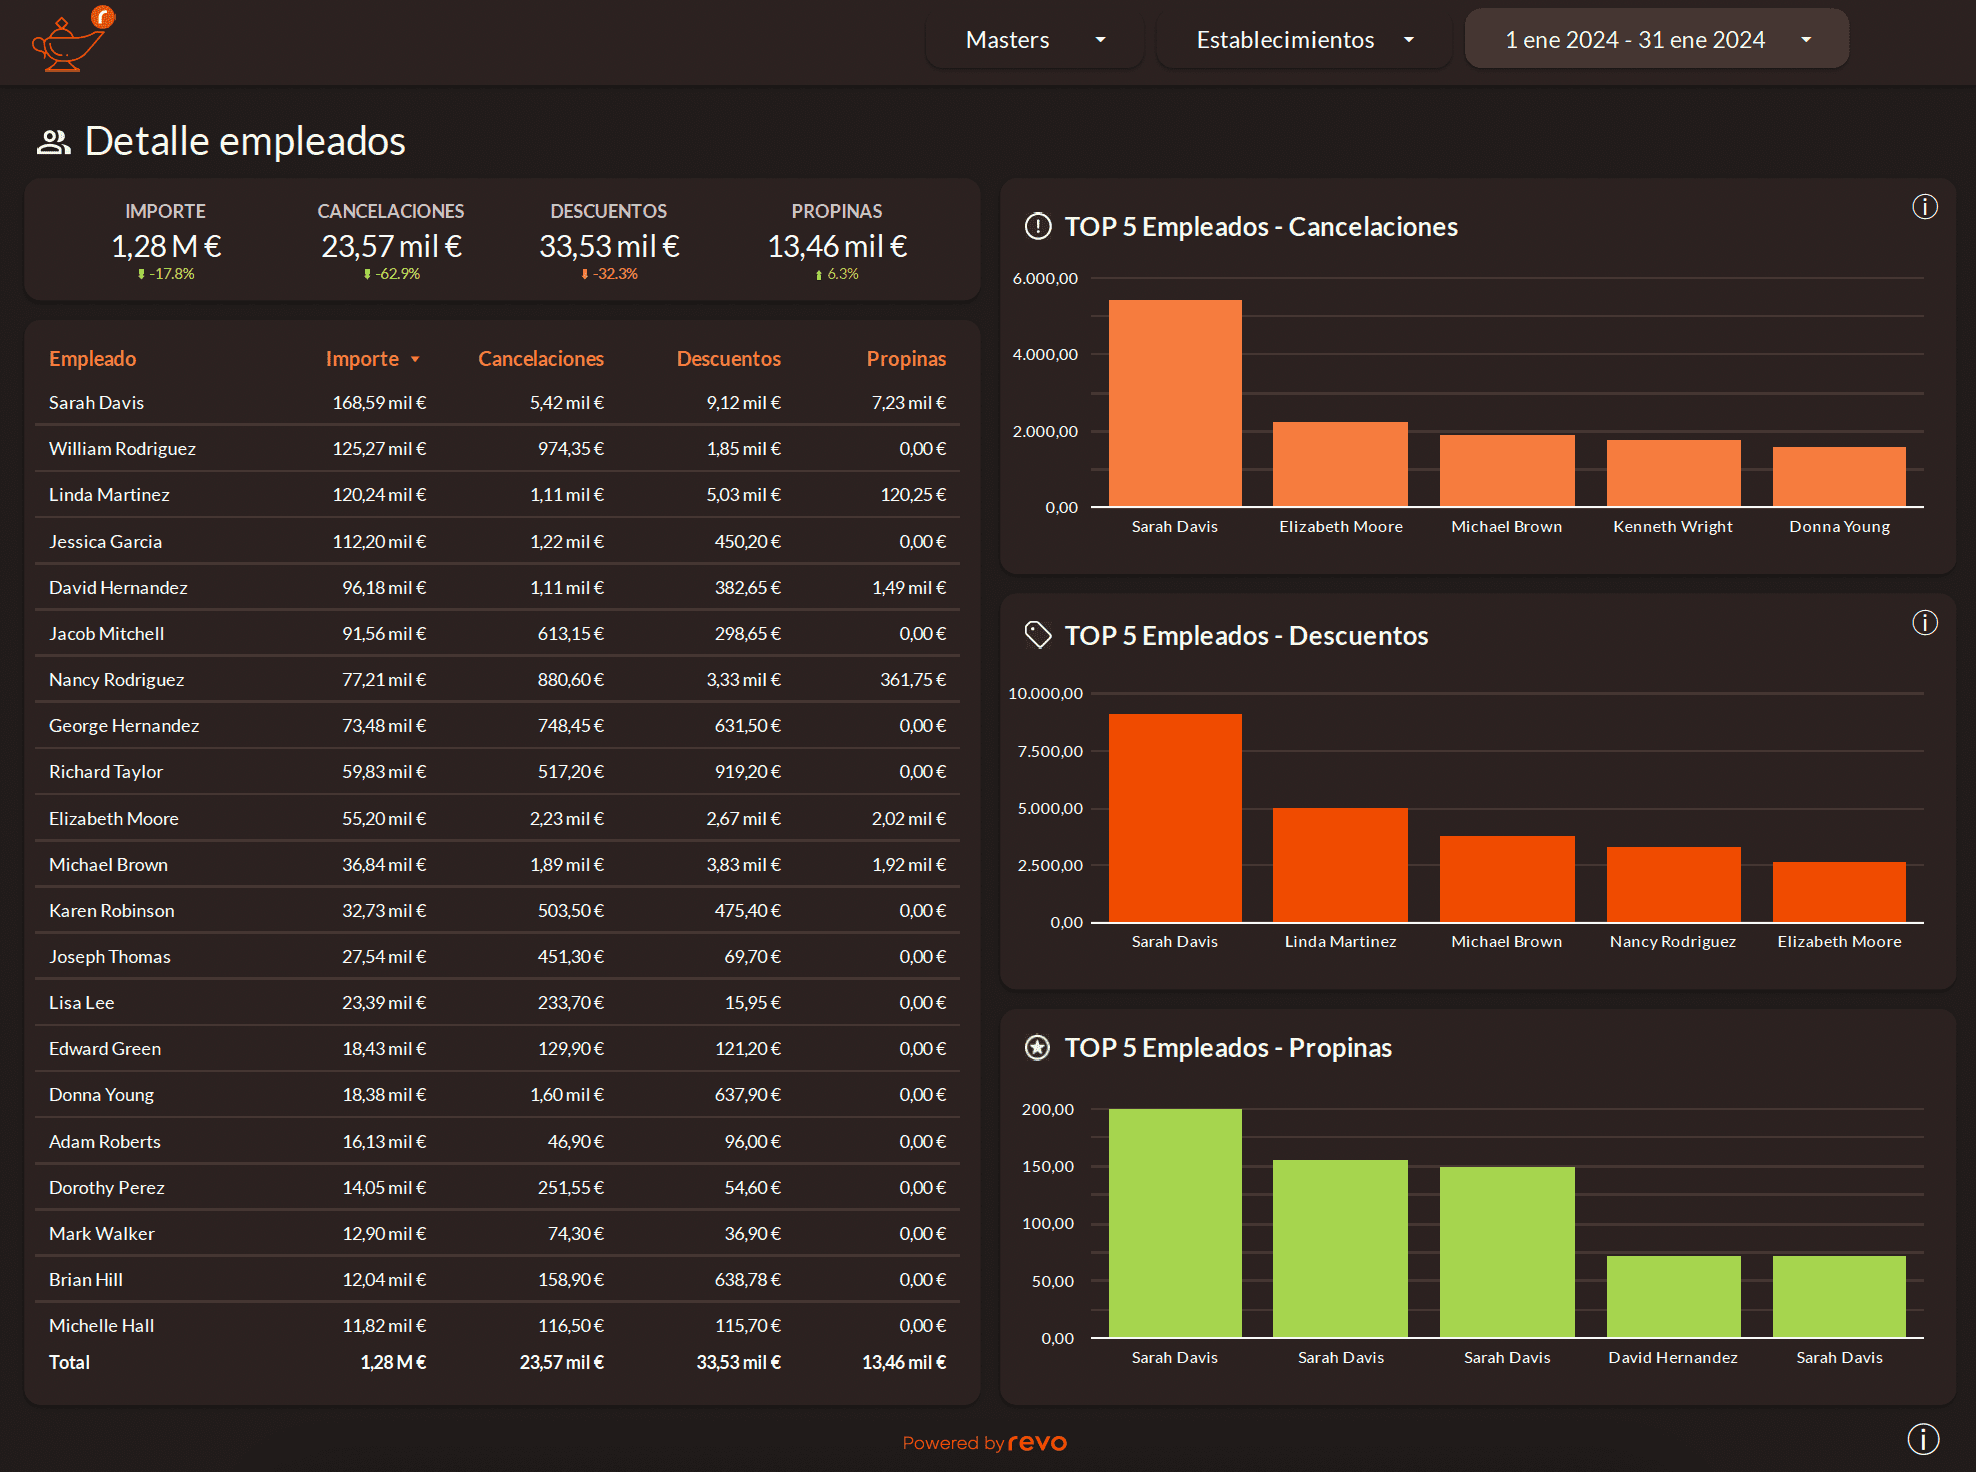
We have the following information detailed in the Employee Details table:
- Employee: It shows us the employees.
- Amount: We can see the earnings obtained.
- Cancellations: Value of cancellations.
- Discounts: Value of discounts.
- Tips: Value of tips.
The three graphs show the top 5 employees who generated the most cancellations, discounts, and tips. These graphs calculate the sum of contents and orders.
3.4 Payments
The payments section consists of 2 parts, where we can obtain the values of sales detailed in different ways:
Payment Methods
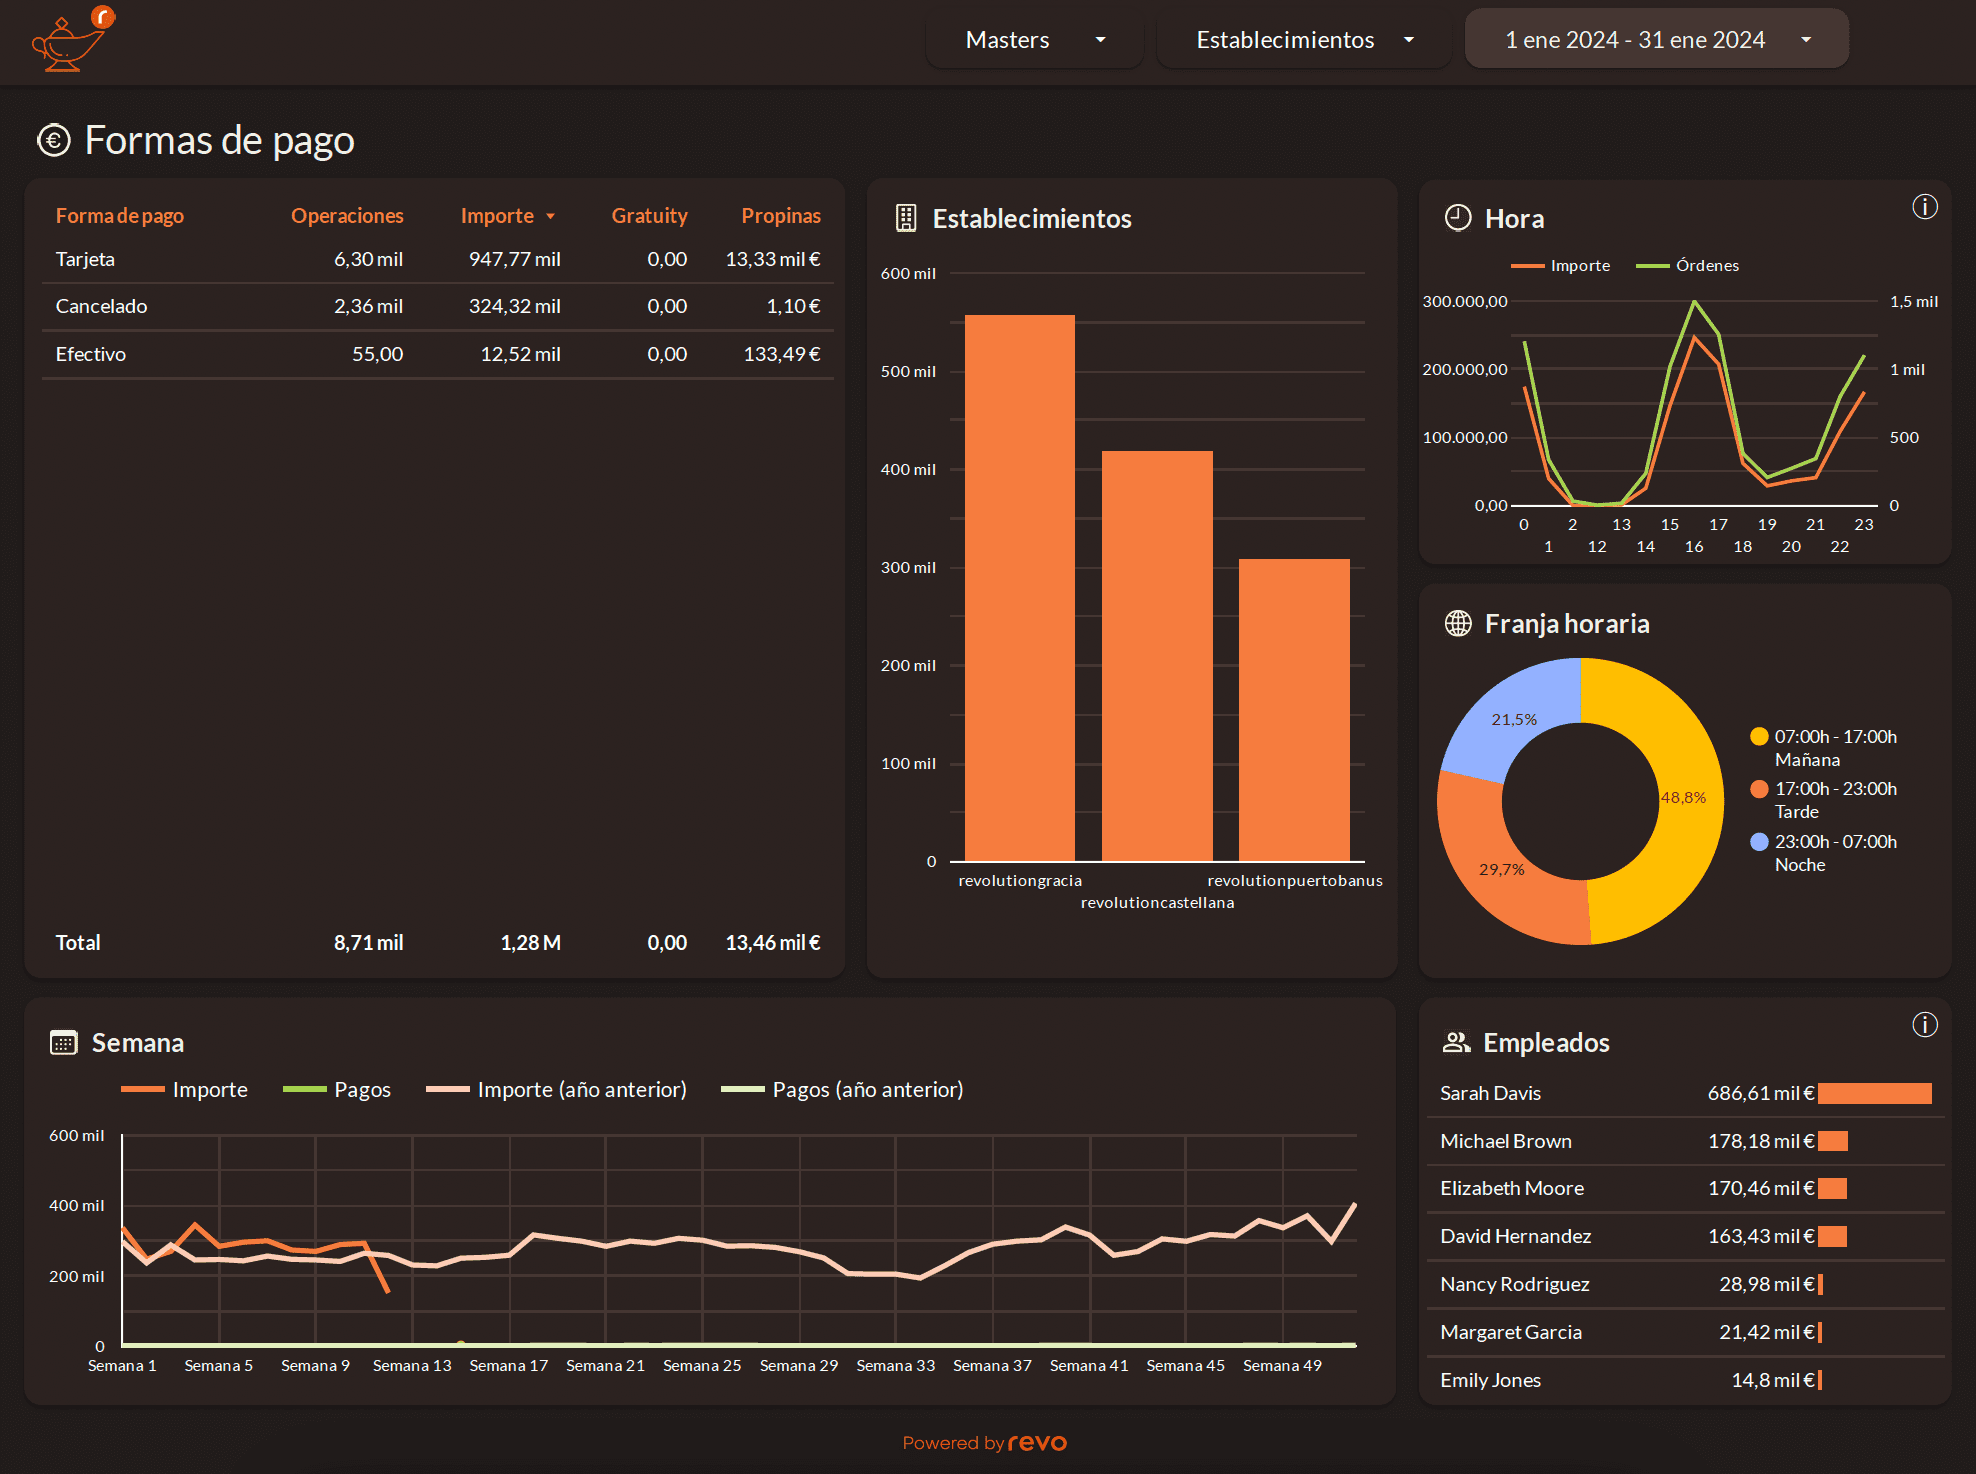
We have the following information detailed in the Payment Method table:
- Payment Method: It shows us the different payment methods.
- Operations: It shows us the number of operations performed.
- Amount: We can see the earnings obtained.
- Gratuity: Displays the gratuity value obtained.
- Tips: Displays the tips value obtained.
Graphs:
- Establishments: Displays the amount obtained separately for the establishments we have added.
- Menu Type: Visually shows the different types of menus we have and their revenue values.
- Time Range and Hour: Details the amounts and orders.
- Week: Shows the product revenues by comparing them with the previous year.
- Employees: Displays the amount obtained for each employee who made the payment.
Shifts / Cash Registers
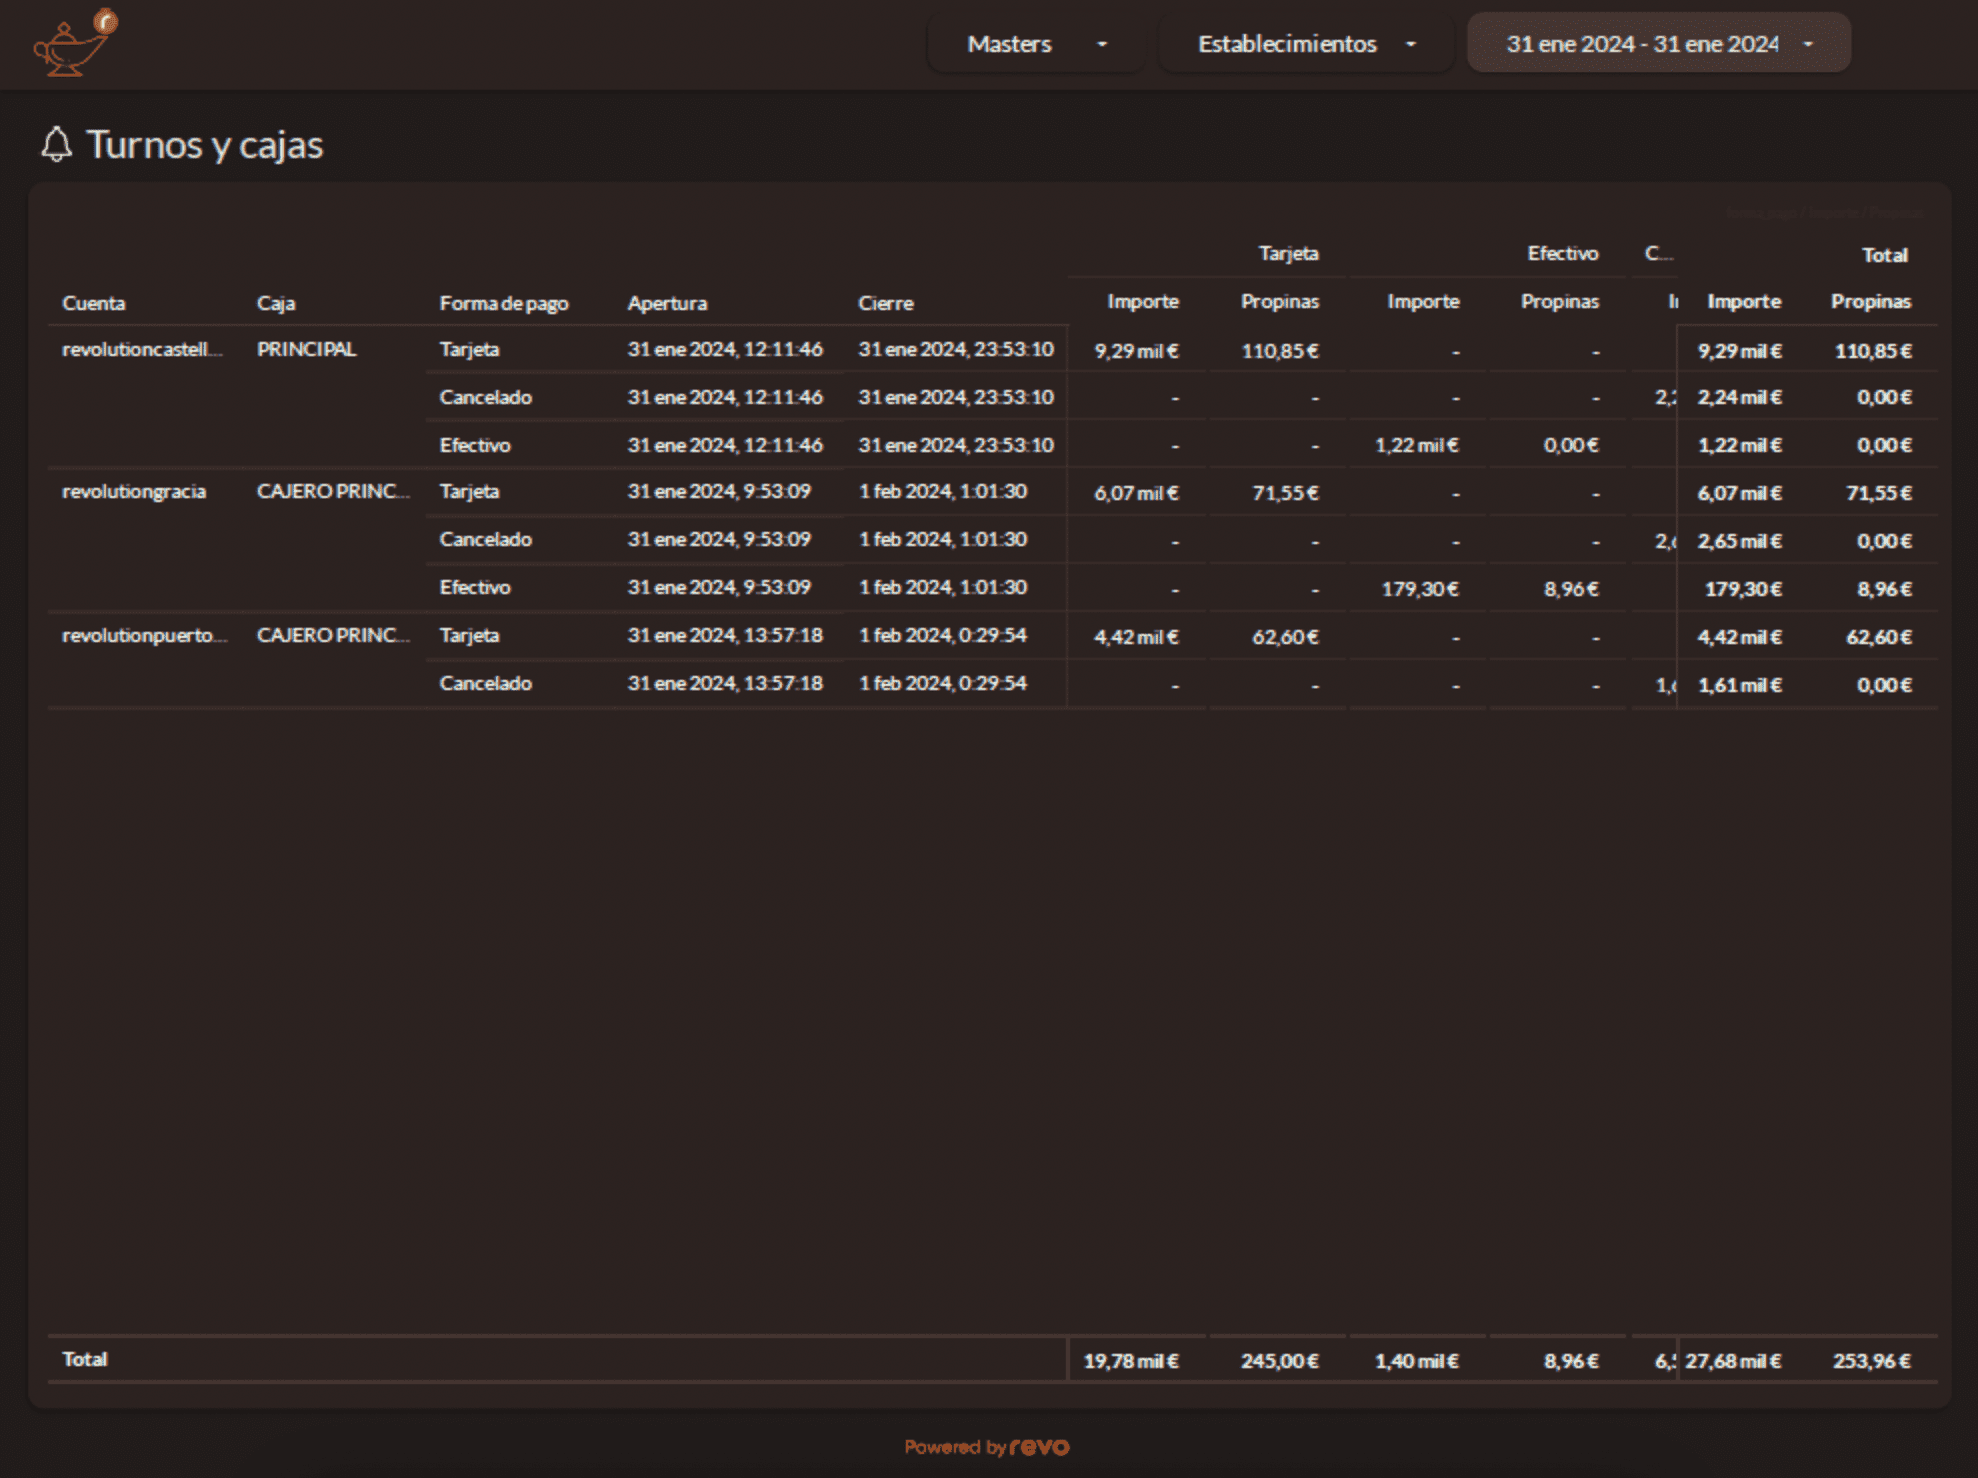
We have the following information detailed in the Shifts and Cash Registers table:
- Establishment: It shows us all the establishments.
- Cash Register: The cash register with which the shift was opened appears.
- Payment Method: It shows us the different payment methods.
- Opening: The date and time of opening of the cash register appears.
- Closing: The date and time of closing of the cash register appears.
- Amount: We can see the earnings obtained, detailed by the different payment methods.
- Tips: We can see the tips obtained detailed by the different payment methods.
- Total: Displays the total value obtained, detailed by the payment method, earnings, and tips.
3.5 Cancellations
The cancellations section consists of 2 parts, where we can obtain the values of cancellations detailed in different ways:
Cancellations
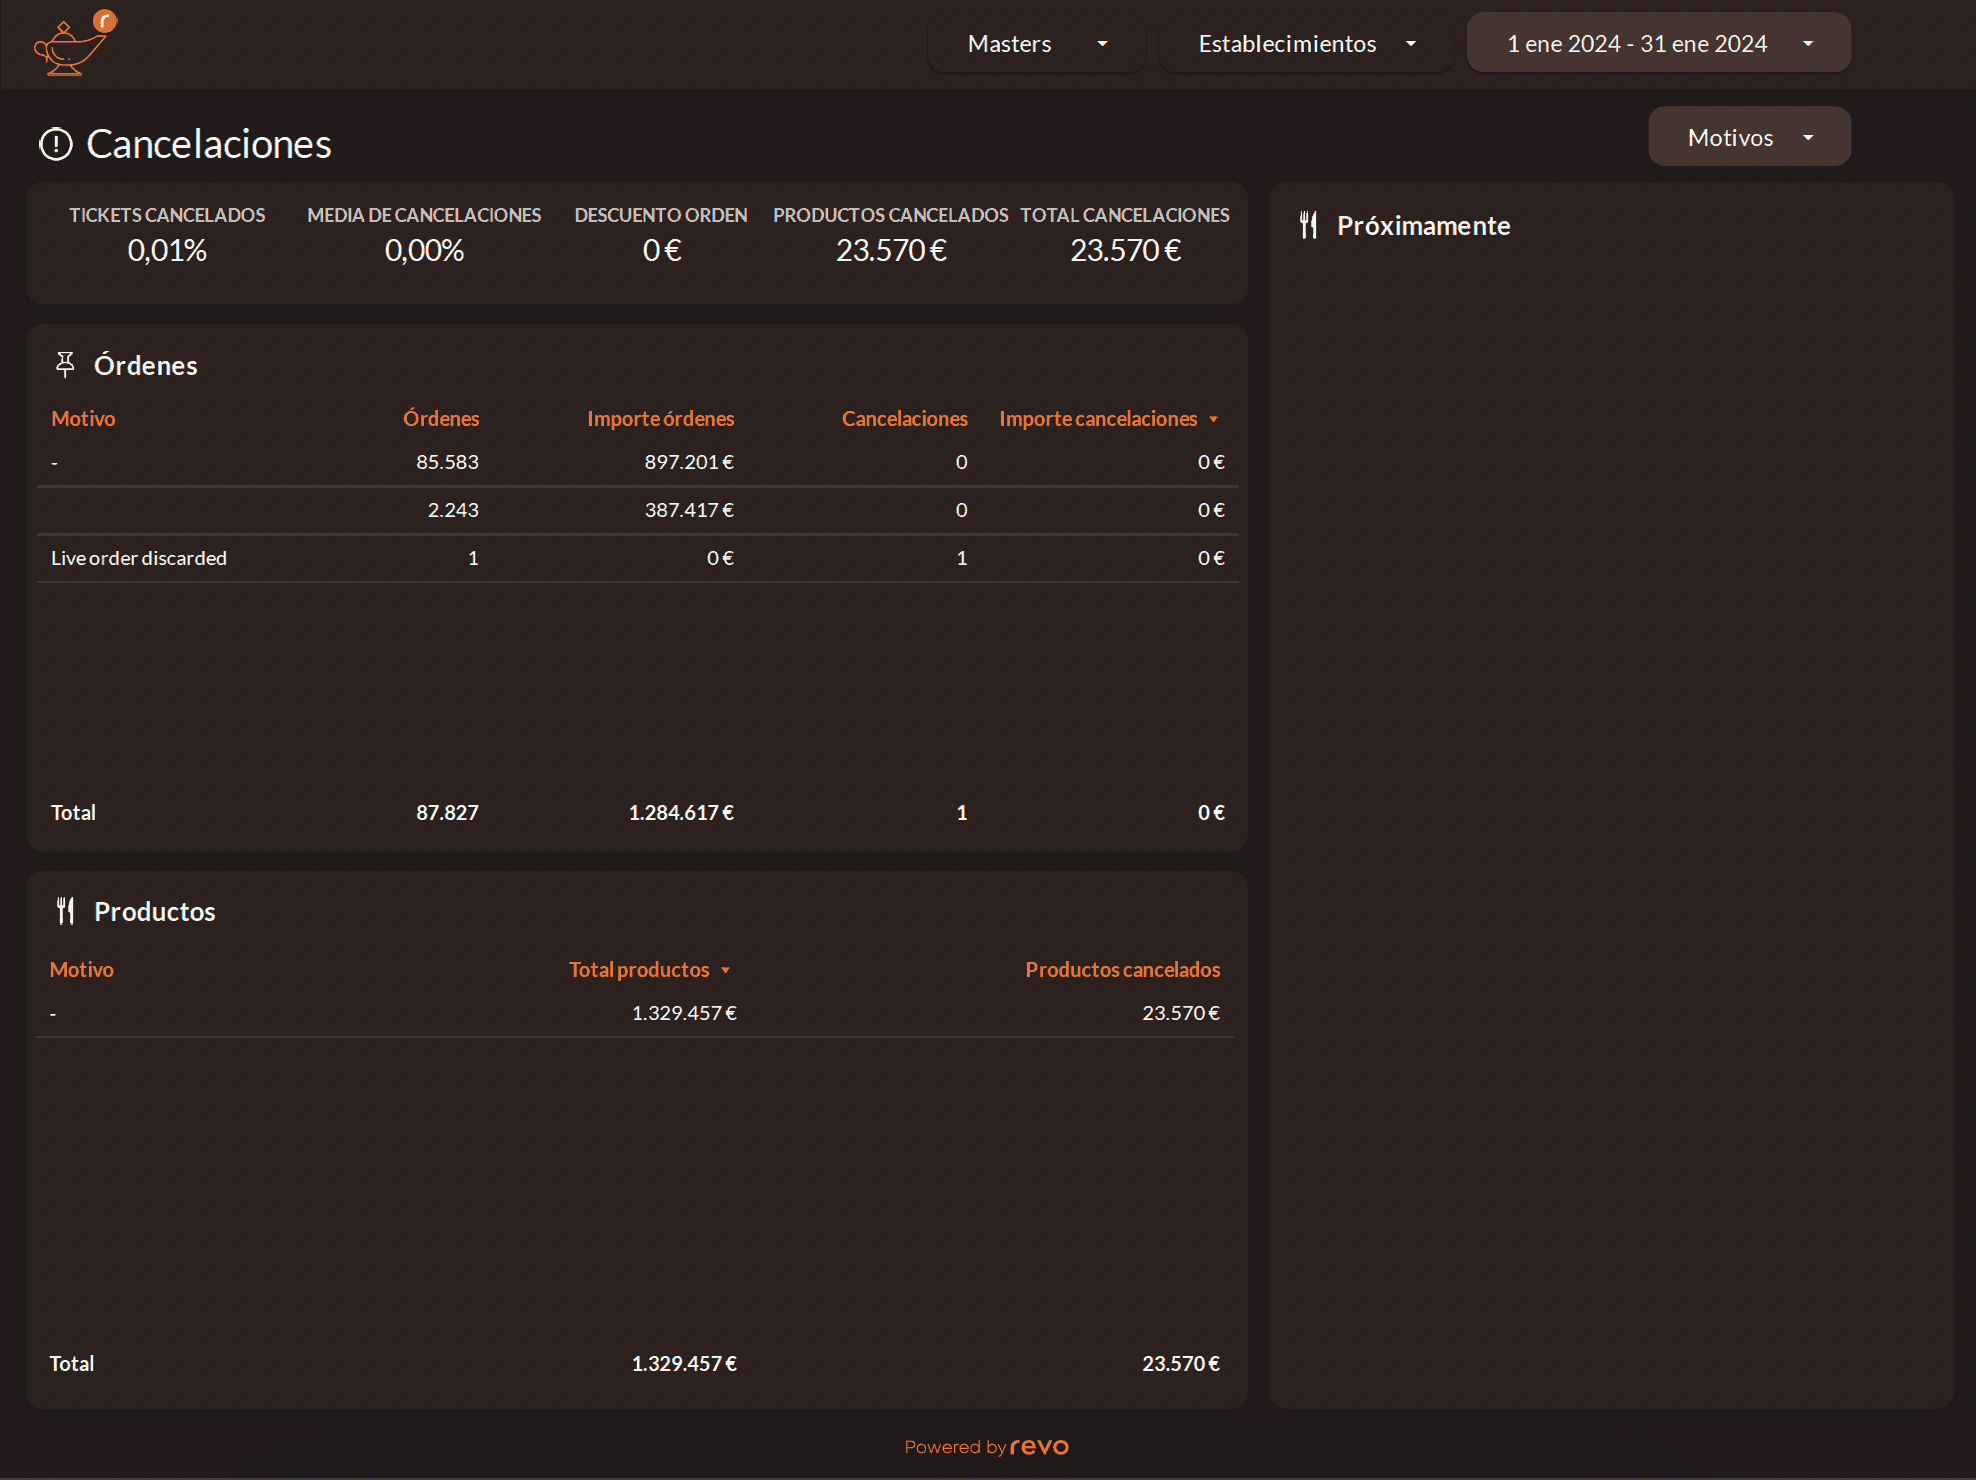
Here is the filter:
- Reasons: We can select the reason to visualize.
We have the following information detailed in the tables:
Orders
- Reason: It shows us the different reasons.
- Orders: It shows us the number of orders placed.
- Order amount: We can see the amount of cancellations by orders.
- Cancellations: Indicates the cancellations made.
- Cancellation amount: Displays the value of cancellations.
Product
- Reason: It shows us the different reasons.
- Total products: It shows us the total amount of cancelled products.
- Cancelled products: Displays the total amount of cancelled products.
Establishments
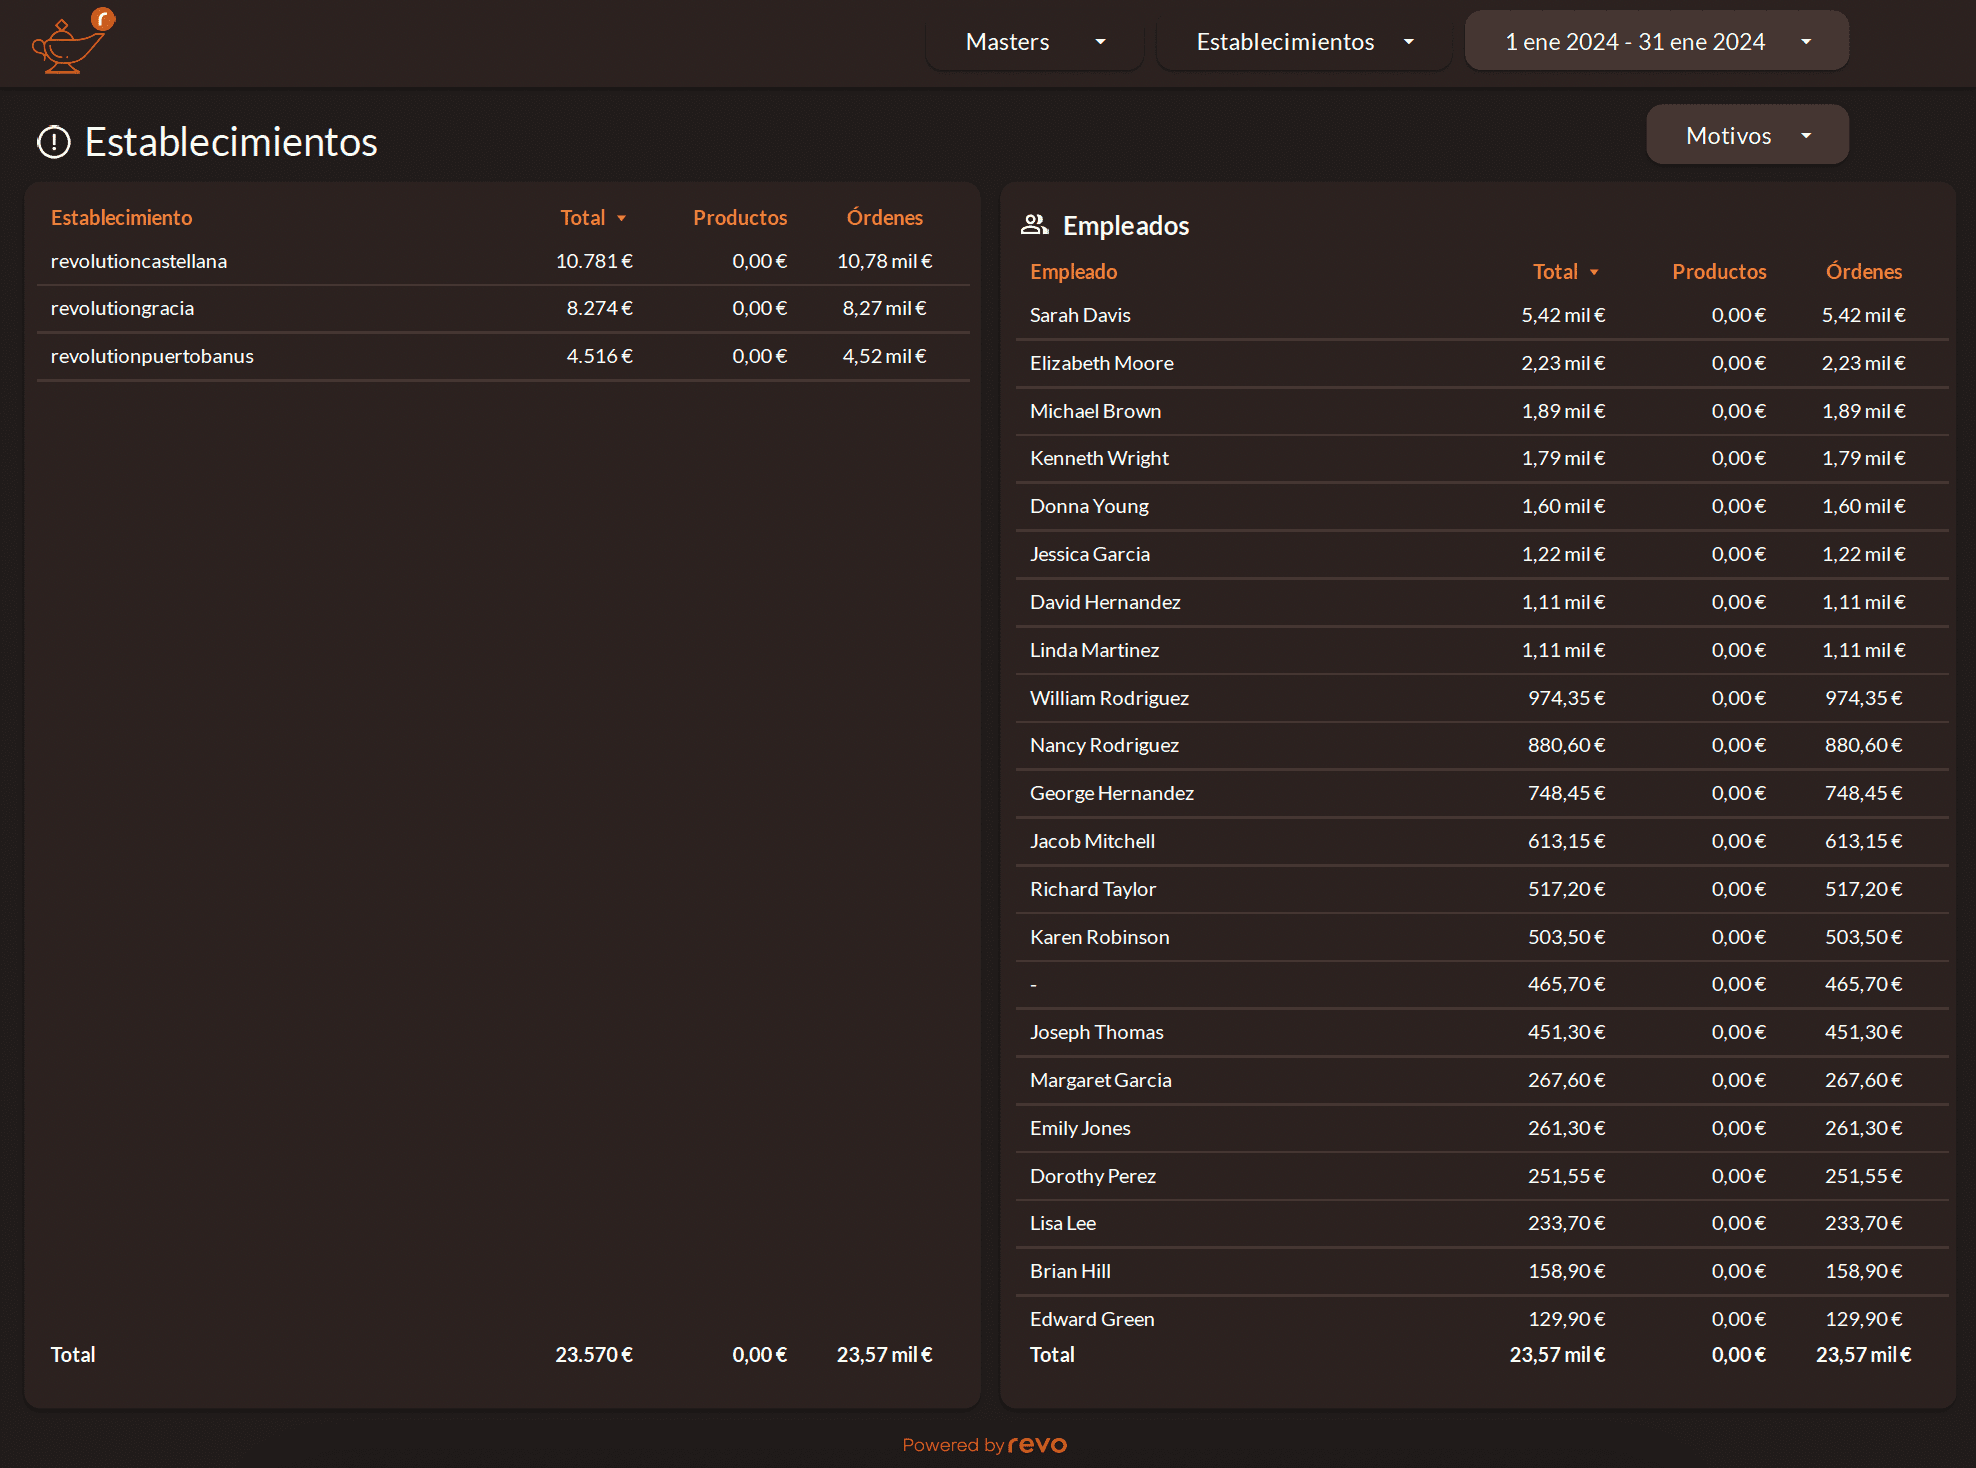
Here we find the filter:
- Reasons: We can select the reason to visualize.
We have the following information broken down into tables:
Establishments
- Establishment: Shows us the different establishments.
- Total: Shows us the amount of cancellations.
- Products: Shows us the value of the cancelled products.
- Orders: Shows us the amount of cancelled orders.
Employees
- Employee: Shows us the different employees.
- Total: Shows us the total amount of cancellations.
- Products: Shows us the value of the cancelled products.
- Orders: Shows us the amount of cancelled orders.
3.6 DISCOUNTS
The discounts section consists of 3 parts, where we can obtain the values of discounts detailed in different ways:
Discounts
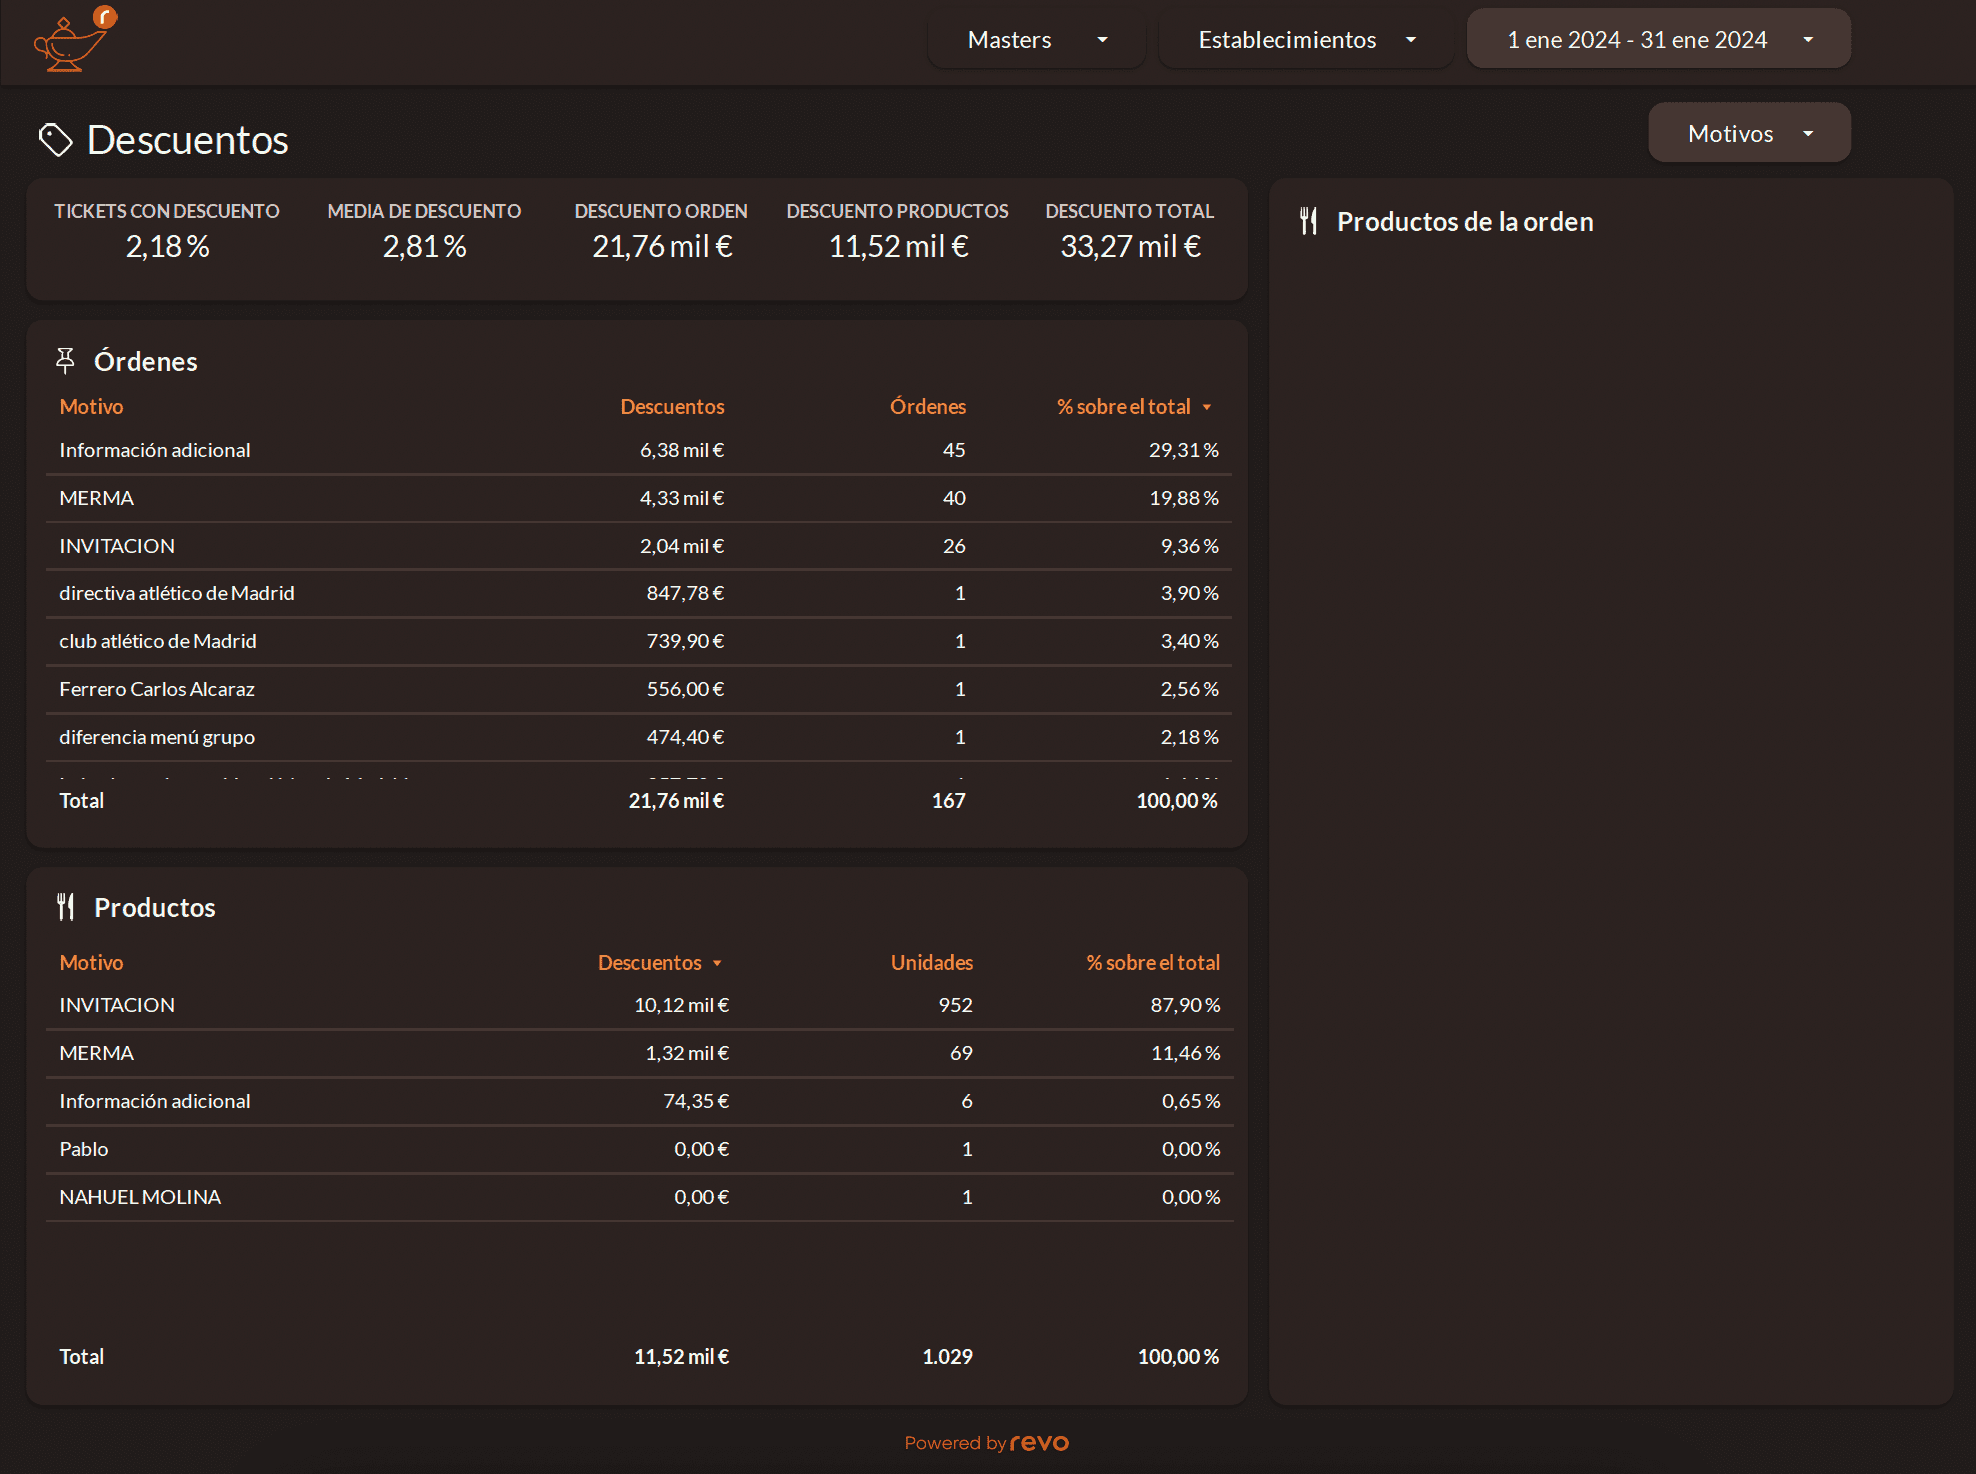
Here we find the filter:
- Reasons: We can select the reason to visualize. Only order discounts are shown, not product discounts.
We have the following information broken down into tables:
Orders
- Reason: Shows us the different discounts. These are the Discounts created in the Revo XEF back office.
- Discounts: Total value of the discounts applied.
- Orders: Shows us the number of orders to which a discount has been applied.
- % of total: Percentage of the total value of orders.
Product
- Reason: Shows us the different discounts. These are the Discounts created in the Revo XEF back office.
- Discounts: Total value of the discounts applied.
- Units: Shows us the number of products to which a discount has been applied.
- % of total: Percentage of the total value of orders.
Customers
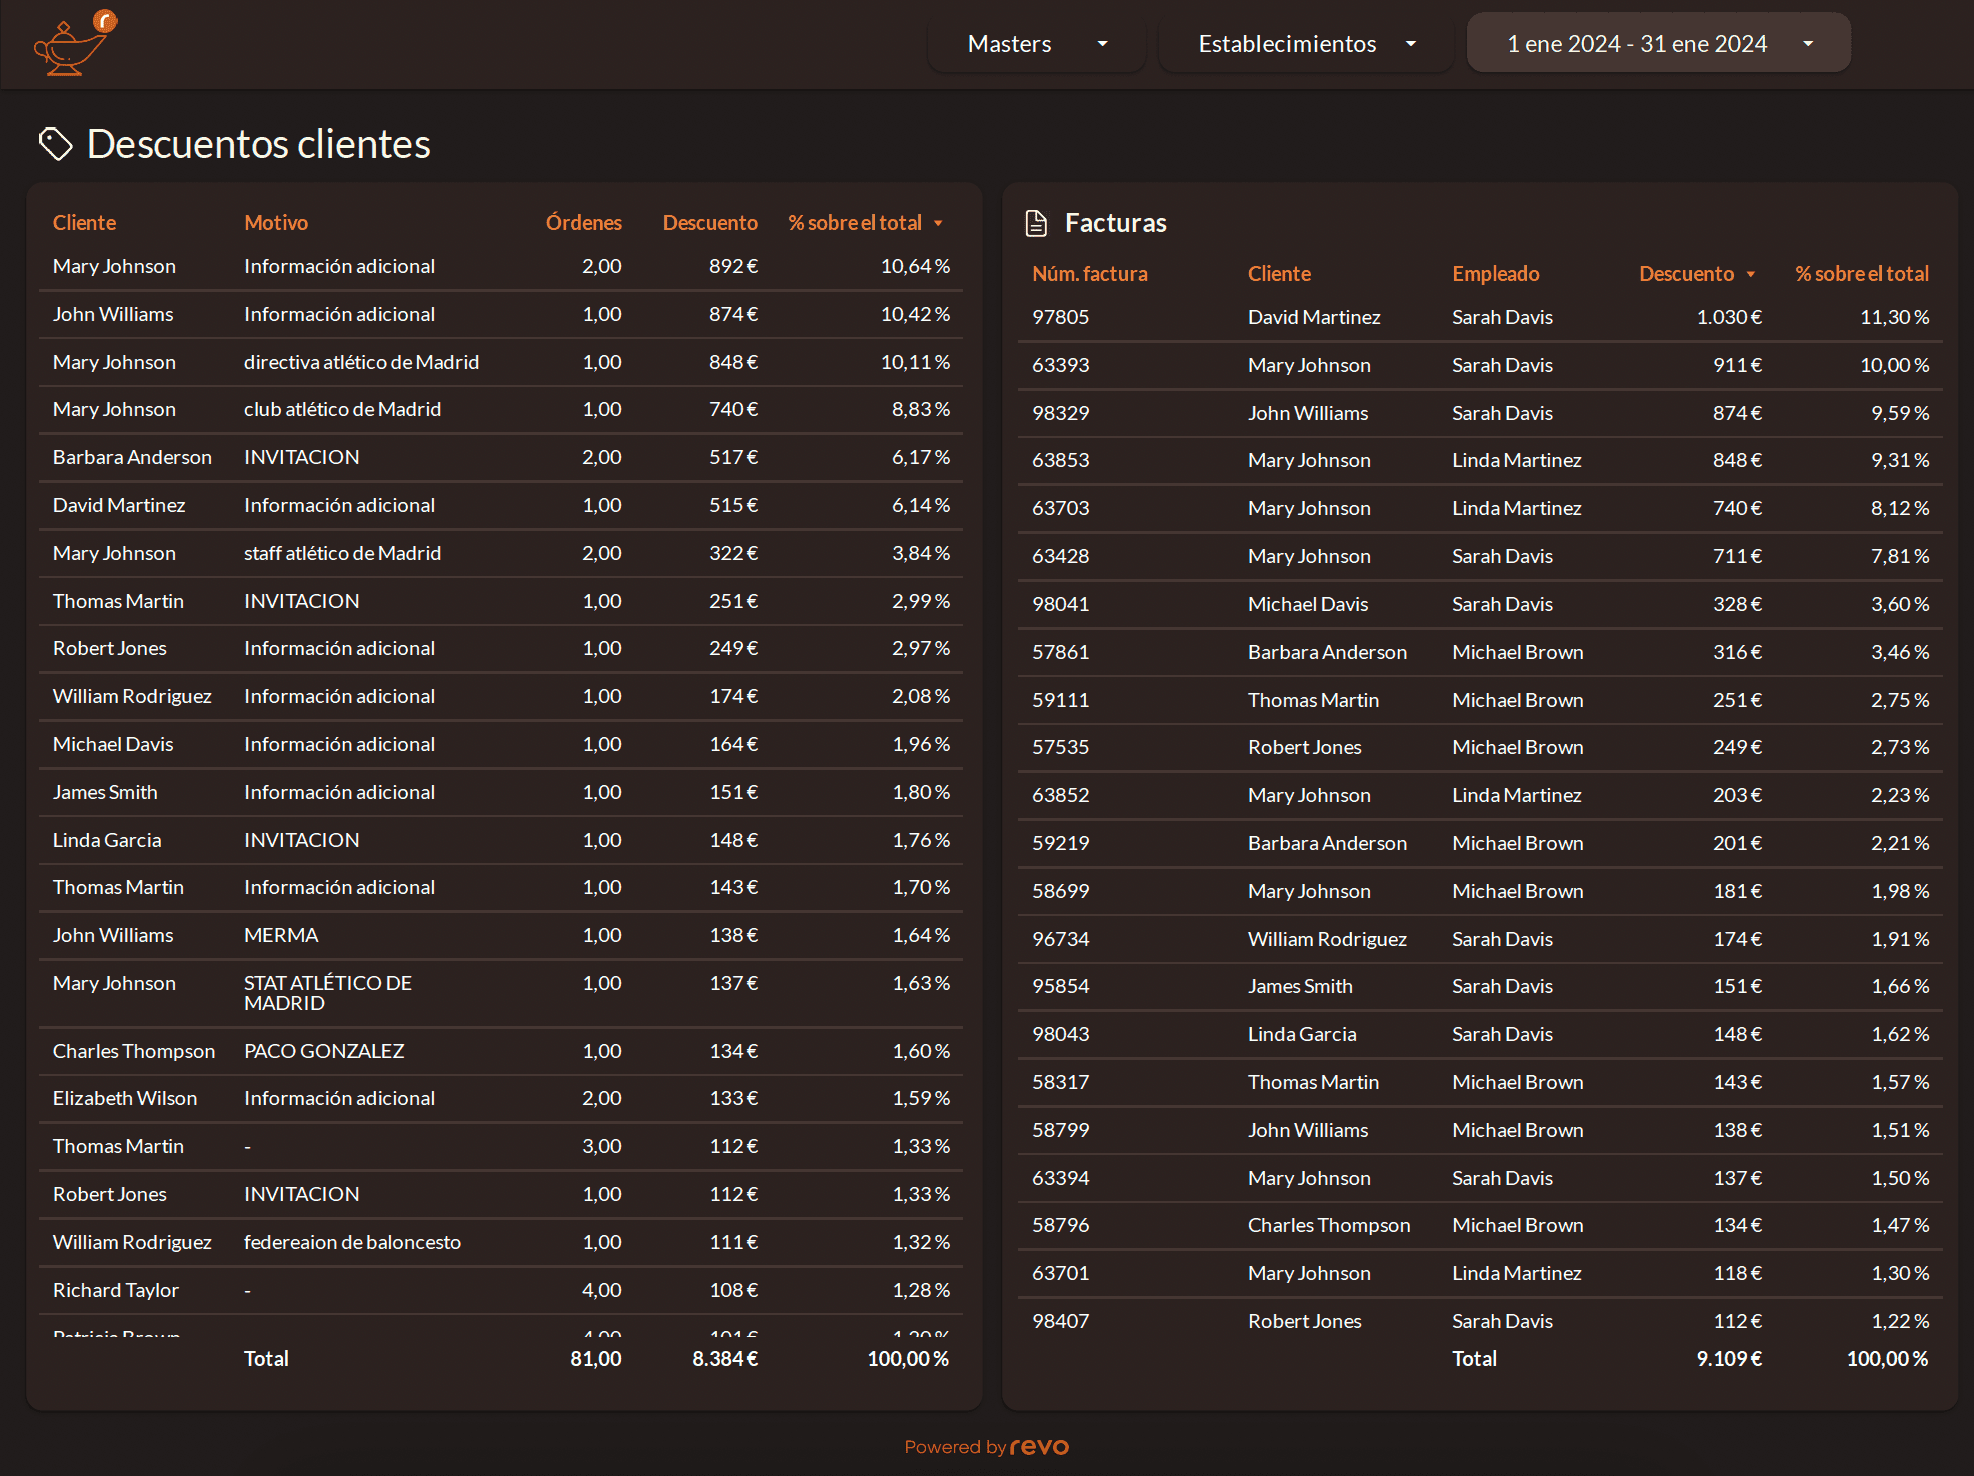
We have the following information broken down into tables:
Customer Discounts
- Customer: Shows us the different customers. These are the Customers created in the Revo XEF back office.
- Reason: Shows us the different discounts. These are the Discounts created in the Revo XEF back office.
- Orders: Shows us the number of orders to which a discount has been applied.
- Discount: Total value of the discounts applied.
- % of total: Percentage of the total value of orders.
Invoices
- Invoice number: Shows us the invoice series.
- Customer: Shows us the different customers.
- Employee: Shows us the employee who applied the discount.
- Discount: Total value of the discounts applied.
- % of total: Percentage of the total value of orders.
Establishment
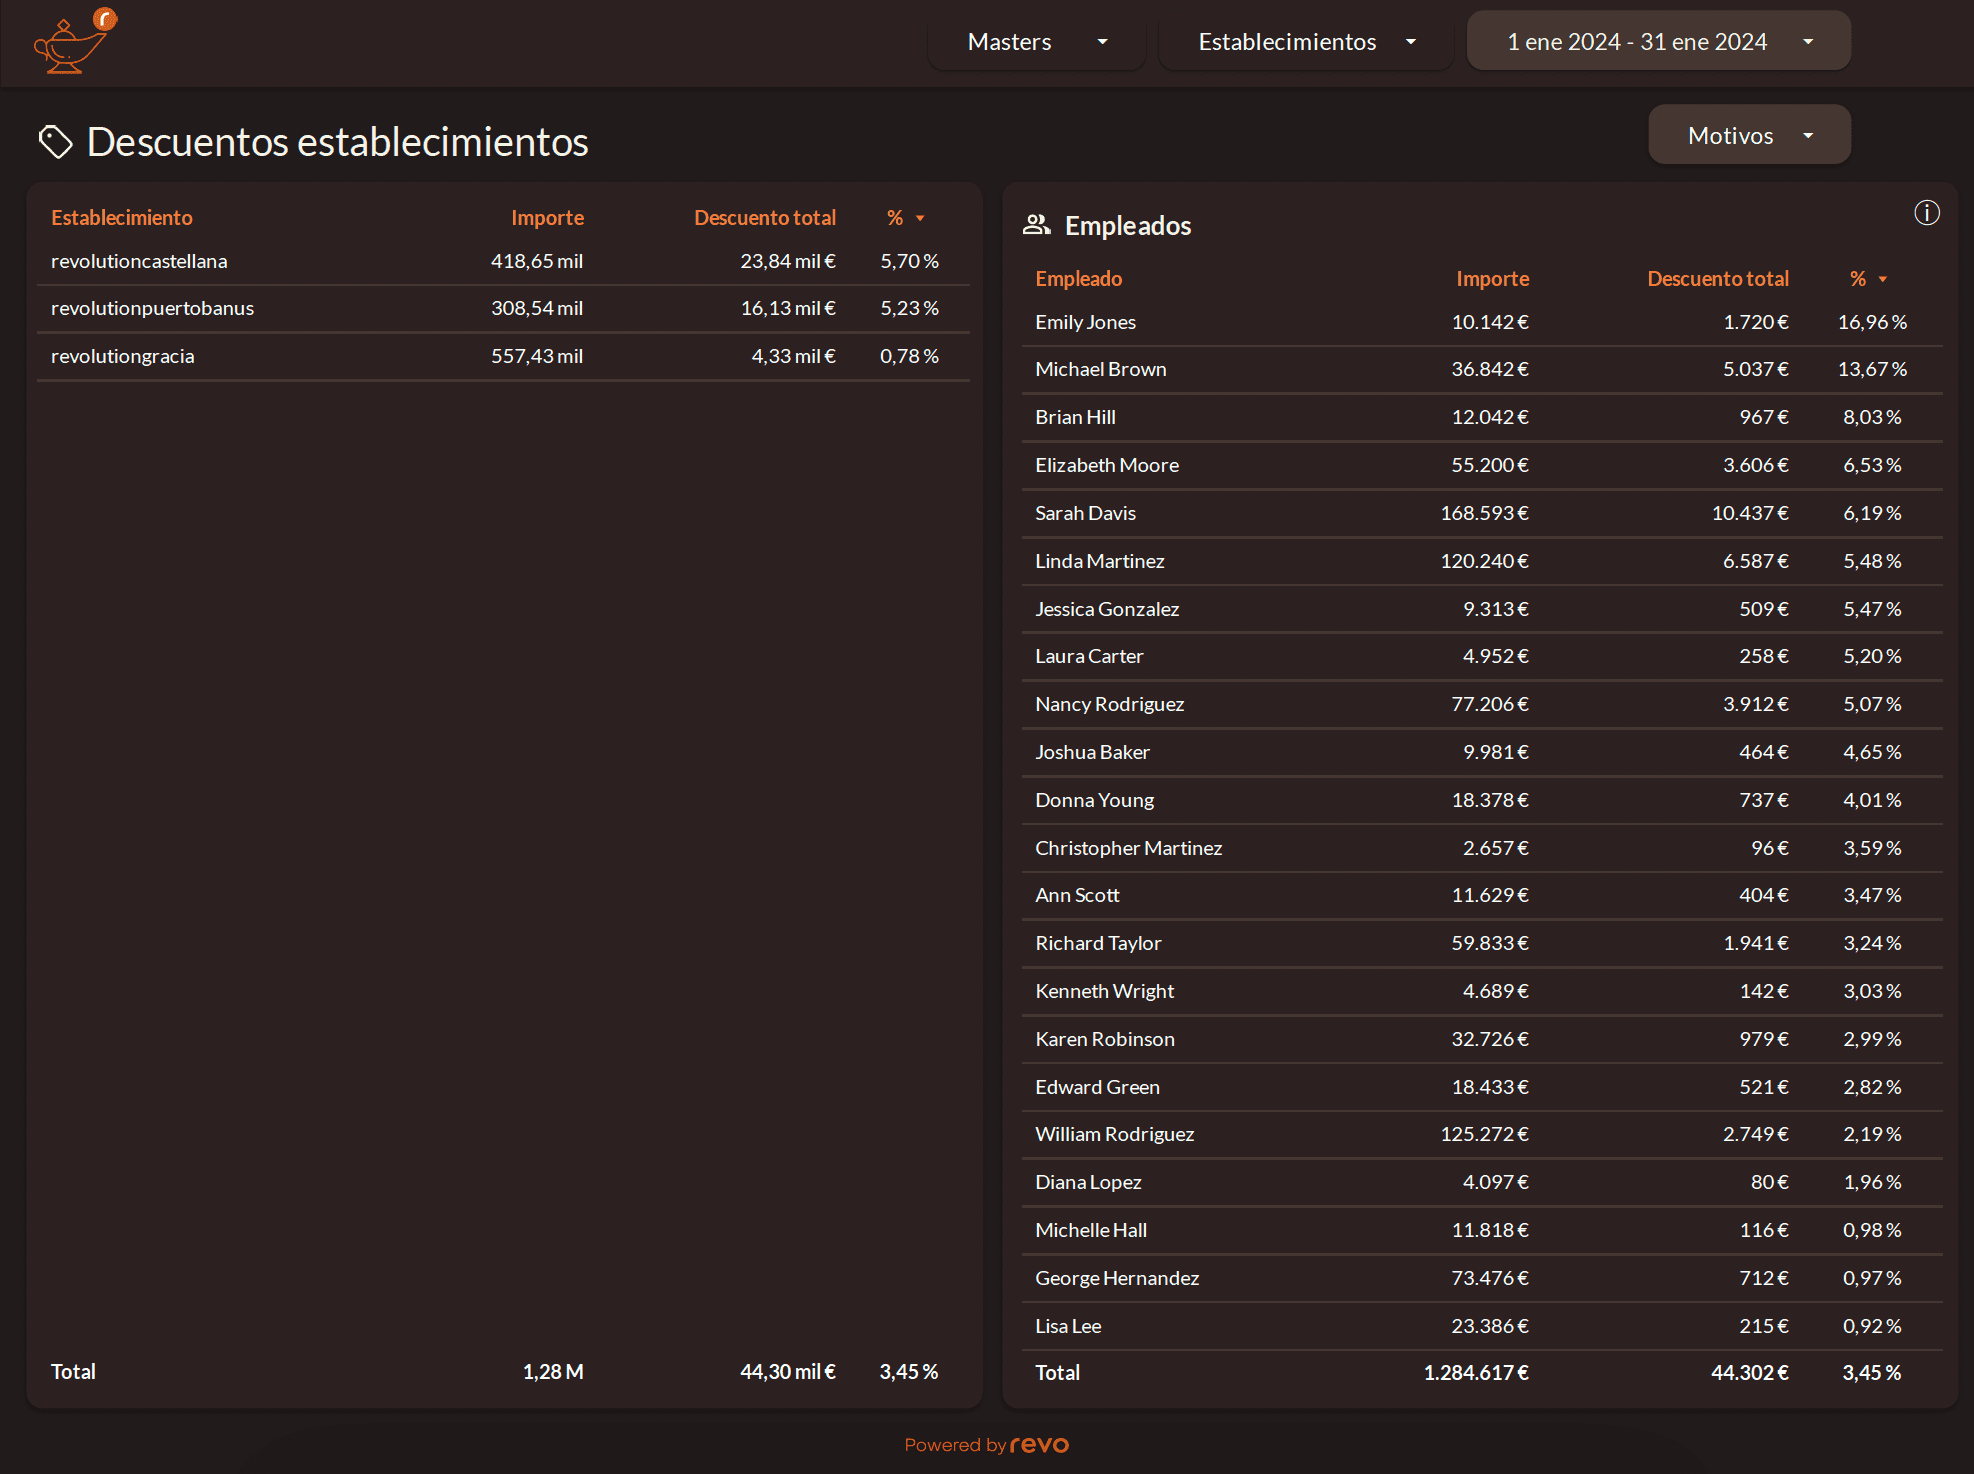
Here we find the filter:
- Reasons: We can select the reason to visualize.
We have the following information broken down into tables:
Establishment Discounts
- Establishment: Shows us the different establishments.
- Amount: Shows us the total amount billed.
- Total discount: Shows us the total value of the discounts.
- : Shows us the percentage of discount applied to the total amount.
Employees
- Employee: Shows us the different employees.
- Amount: Shows us the total amount billed.
- Total discount: Shows us the total value of the discounts.
- : Shows us the percentage of discount applied to the total amount.
3.7 TIPS
The tips section consists of 2 parts, where we can obtain the values of tips detailed in different ways:
Tips
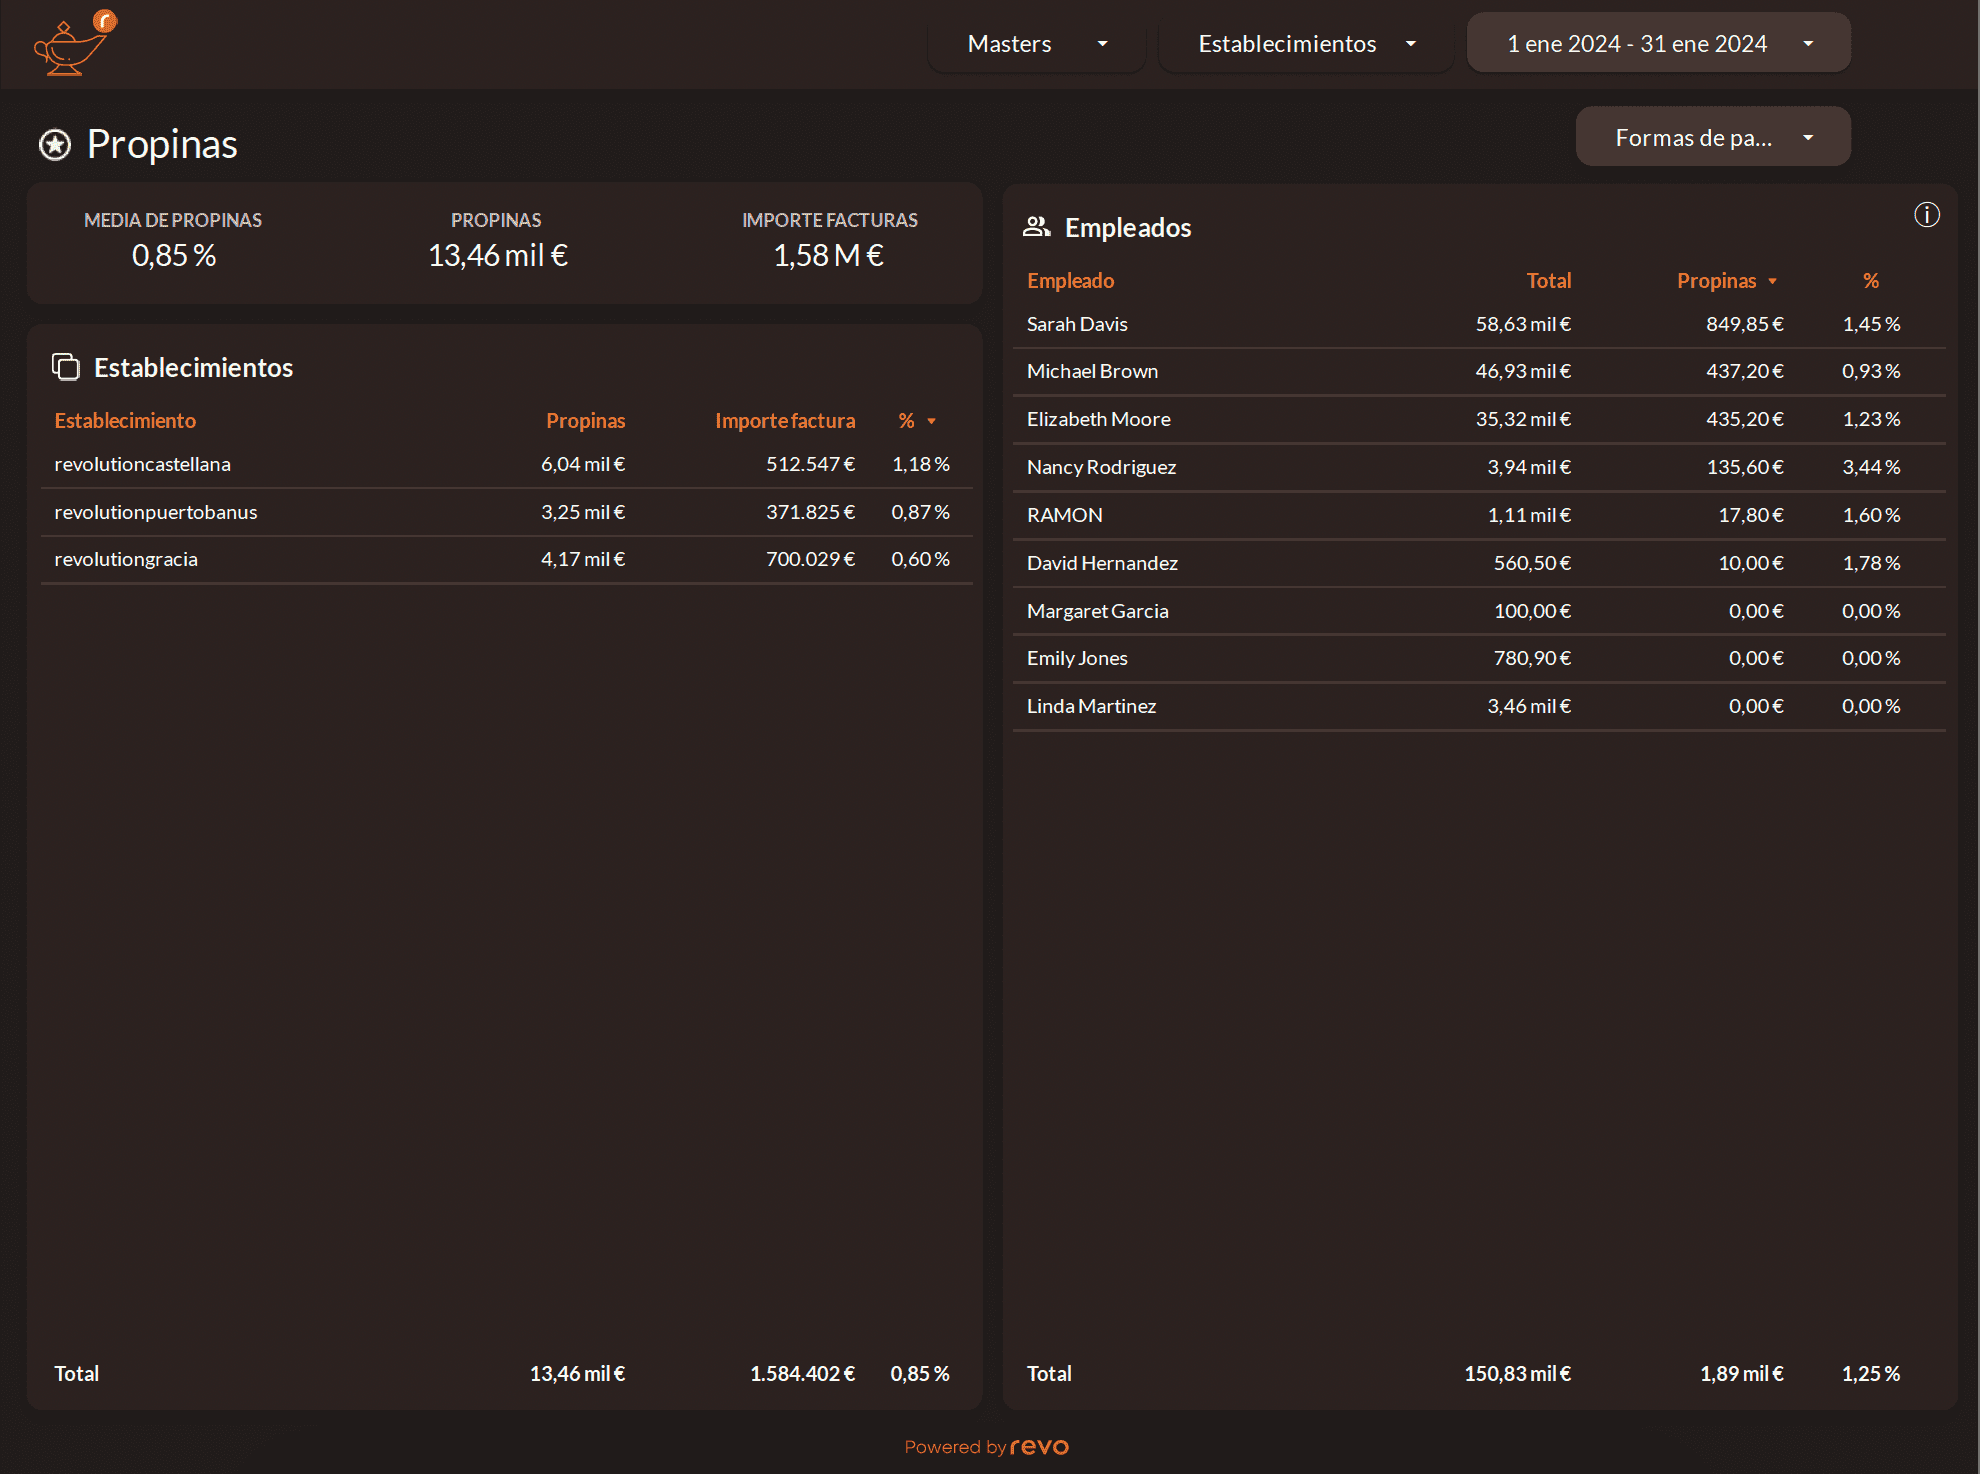
Here we find the filter:
- Payment methods: We can select the payment method to visualize.
We have the following information broken down into tables:
Establishments
- Establishment: Shows us the different establishments.
- Tips: Total value of the tips obtained.
- Invoice amount: Shows us the invoiced amount.
- : From the invoiced amount, shows us the tip percentage.
Employees
- Employee: Shows us the different employees.
- Total: Total of the invoice amount.
- Tips: Total value of the tips obtained.
- : From the invoiced amount, shows us the tip percentage.
Tips Details
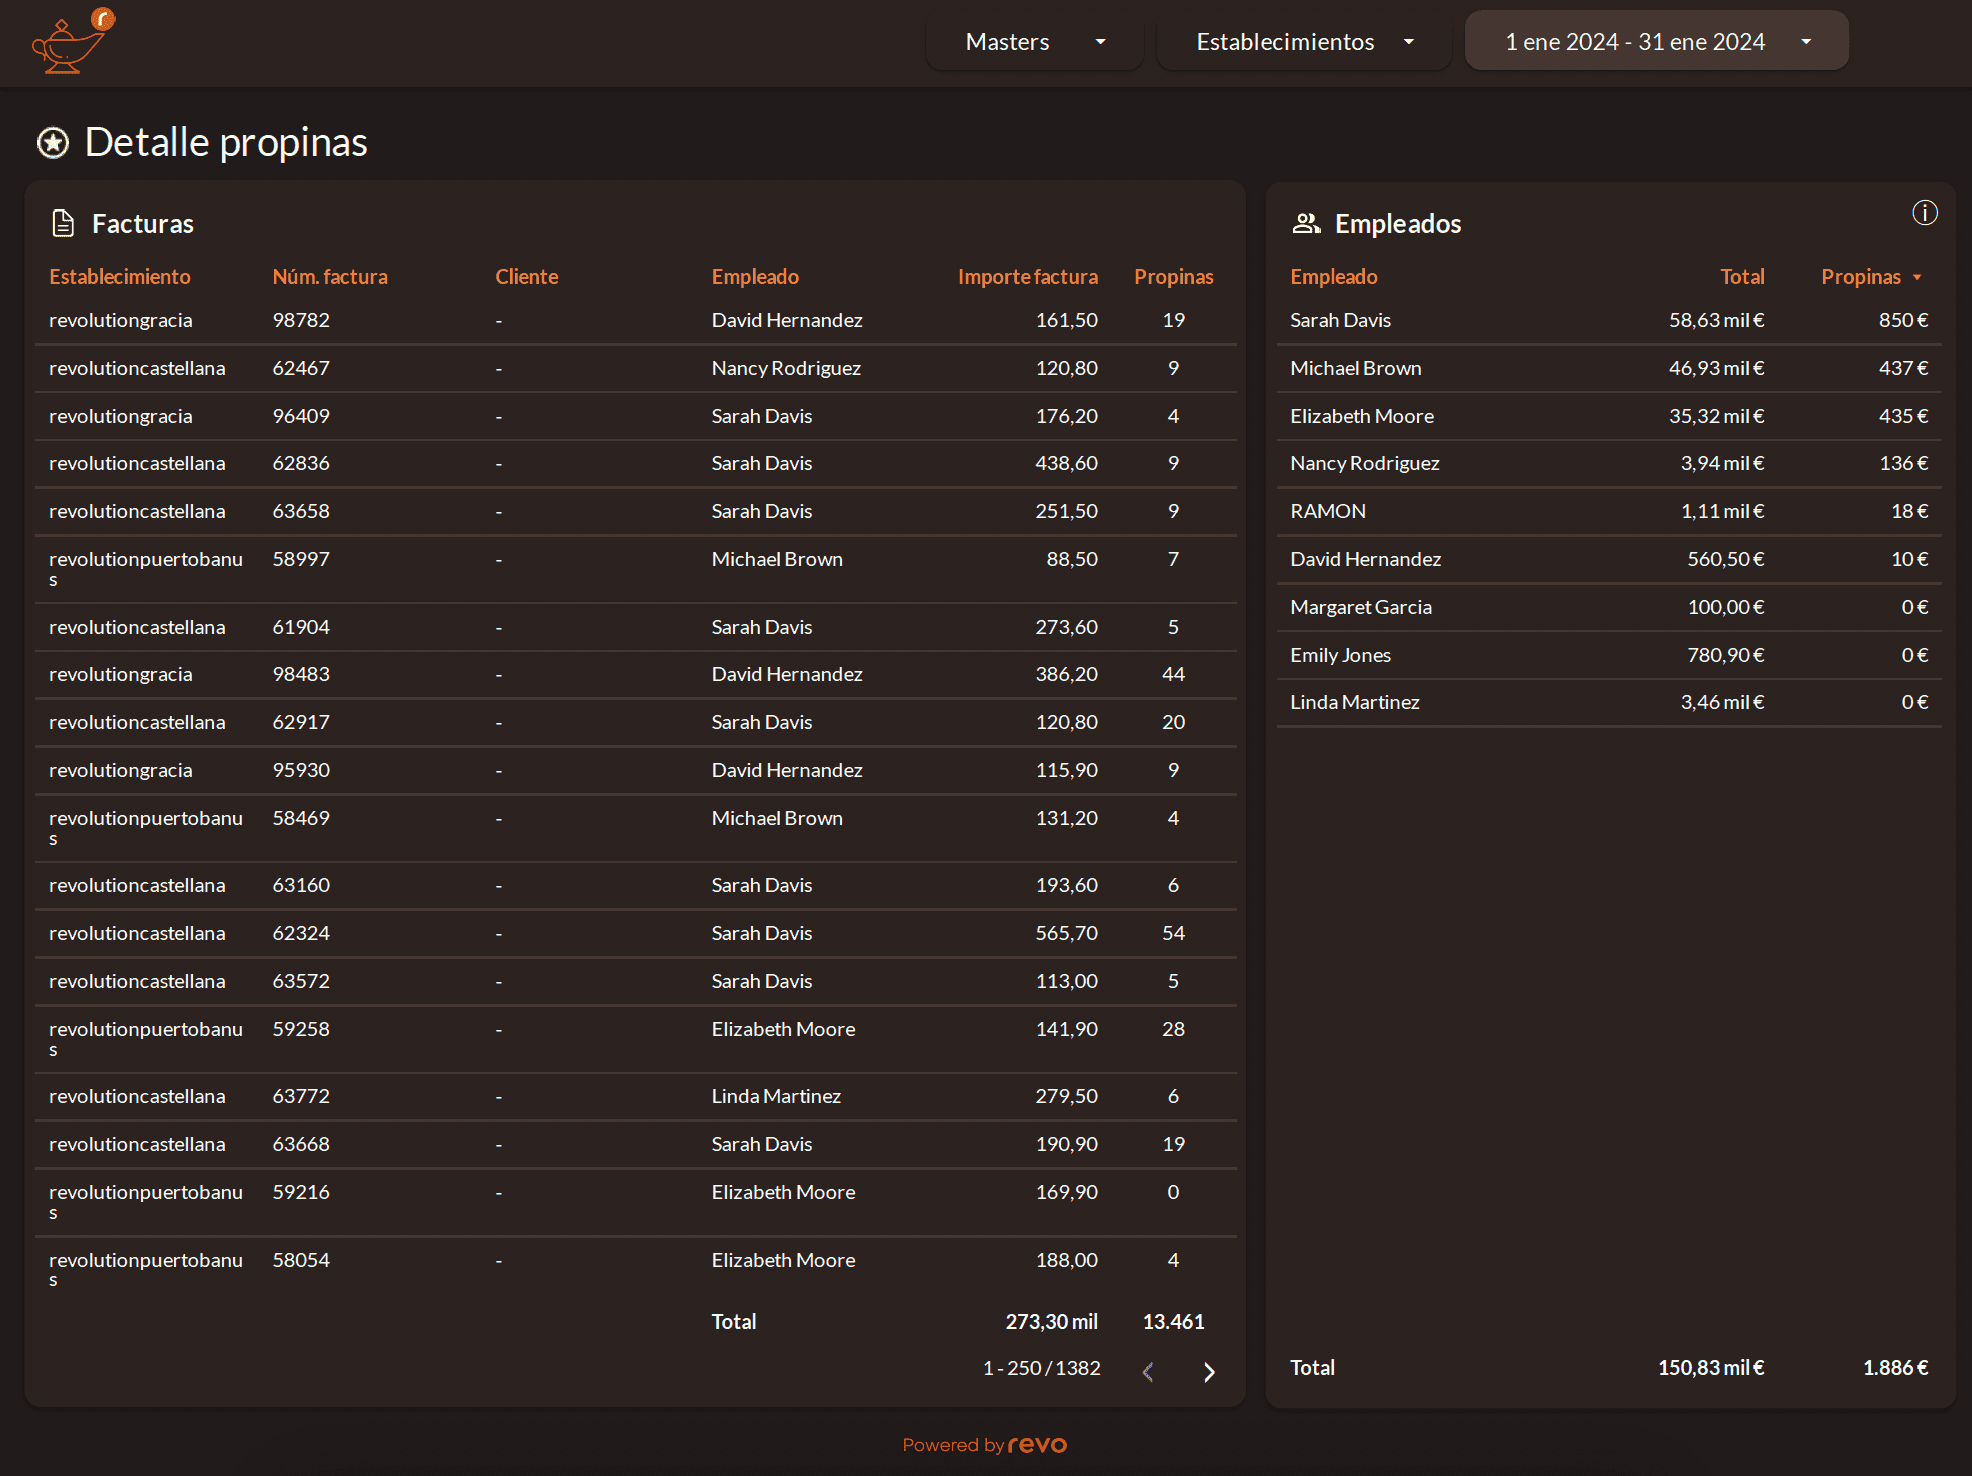
We have the following information detailed in the tables:
Invoices
- Establishments: It shows us the different establishments.
- Invoice number: The invoice series appears.
- Customer: The customer's name appears if it is a nominative invoice.
- Employee: Name of the employee who generated the invoice.
- Invoice amount: It shows us the invoiced amount.
- Tips: Value of the tips.
Employees
- Employee: It shows us the different employees.
- Total: Total amount of the invoices.
- Tips: Total value of the tips obtained.
3.8 DELIVERY
The delivery section consists of 2 parts, where we can obtain detailed revenues in different ways:
Delivery
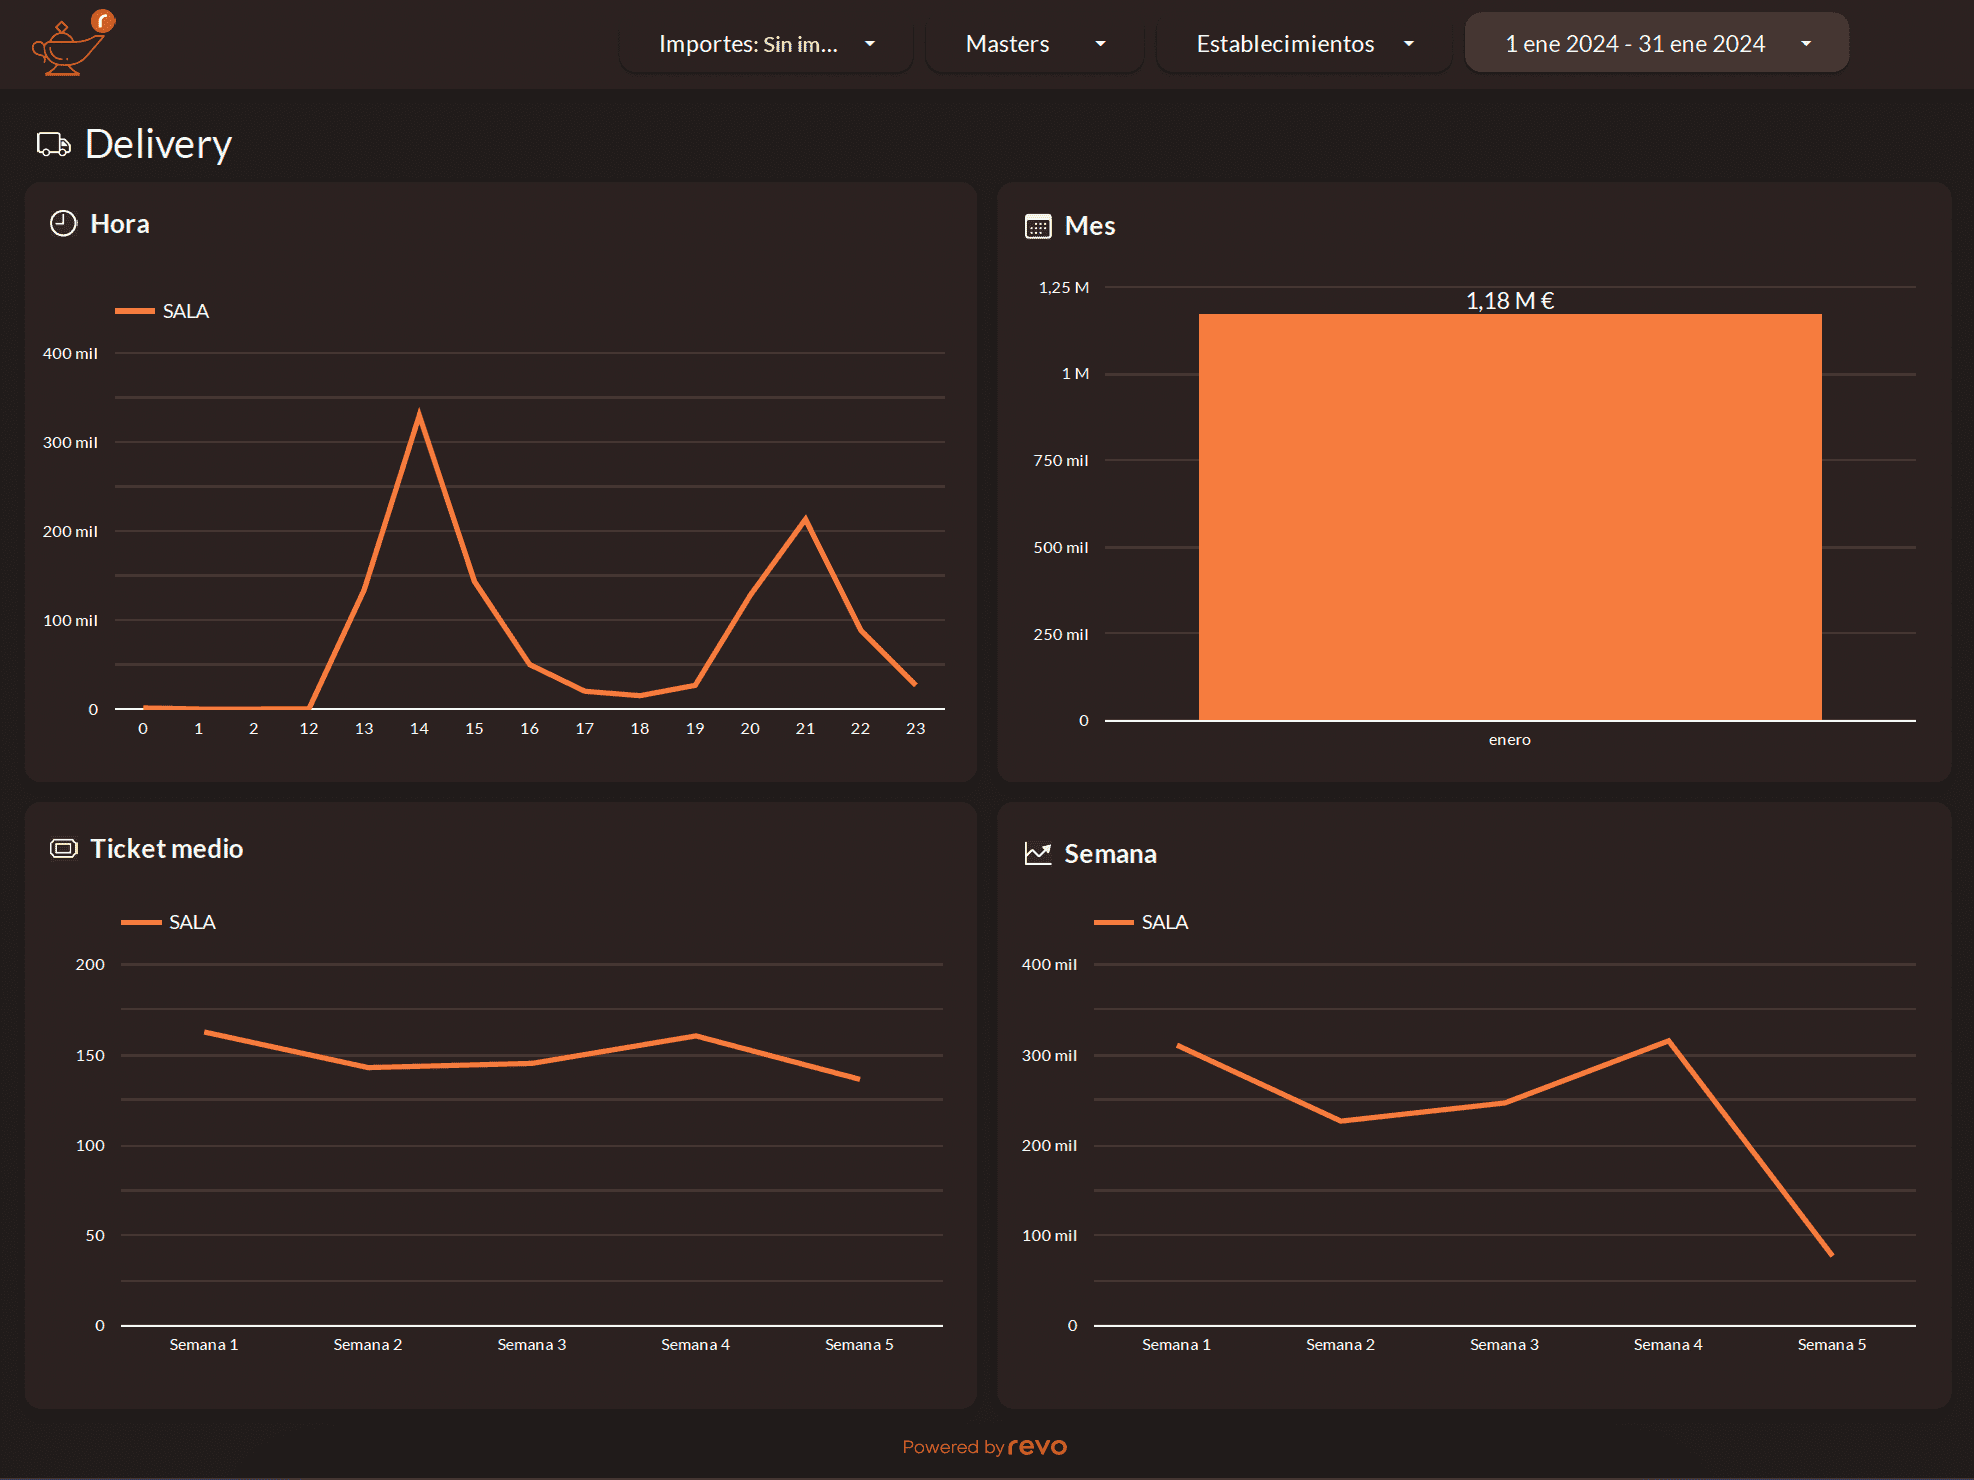
Graphs:
- Sales by hour/week/month: It shows us the sales value by hour/week/month of the deliveries.
- Average ticket per week: It shows us the average value of sales per weeks of the deliveries.
Establishments
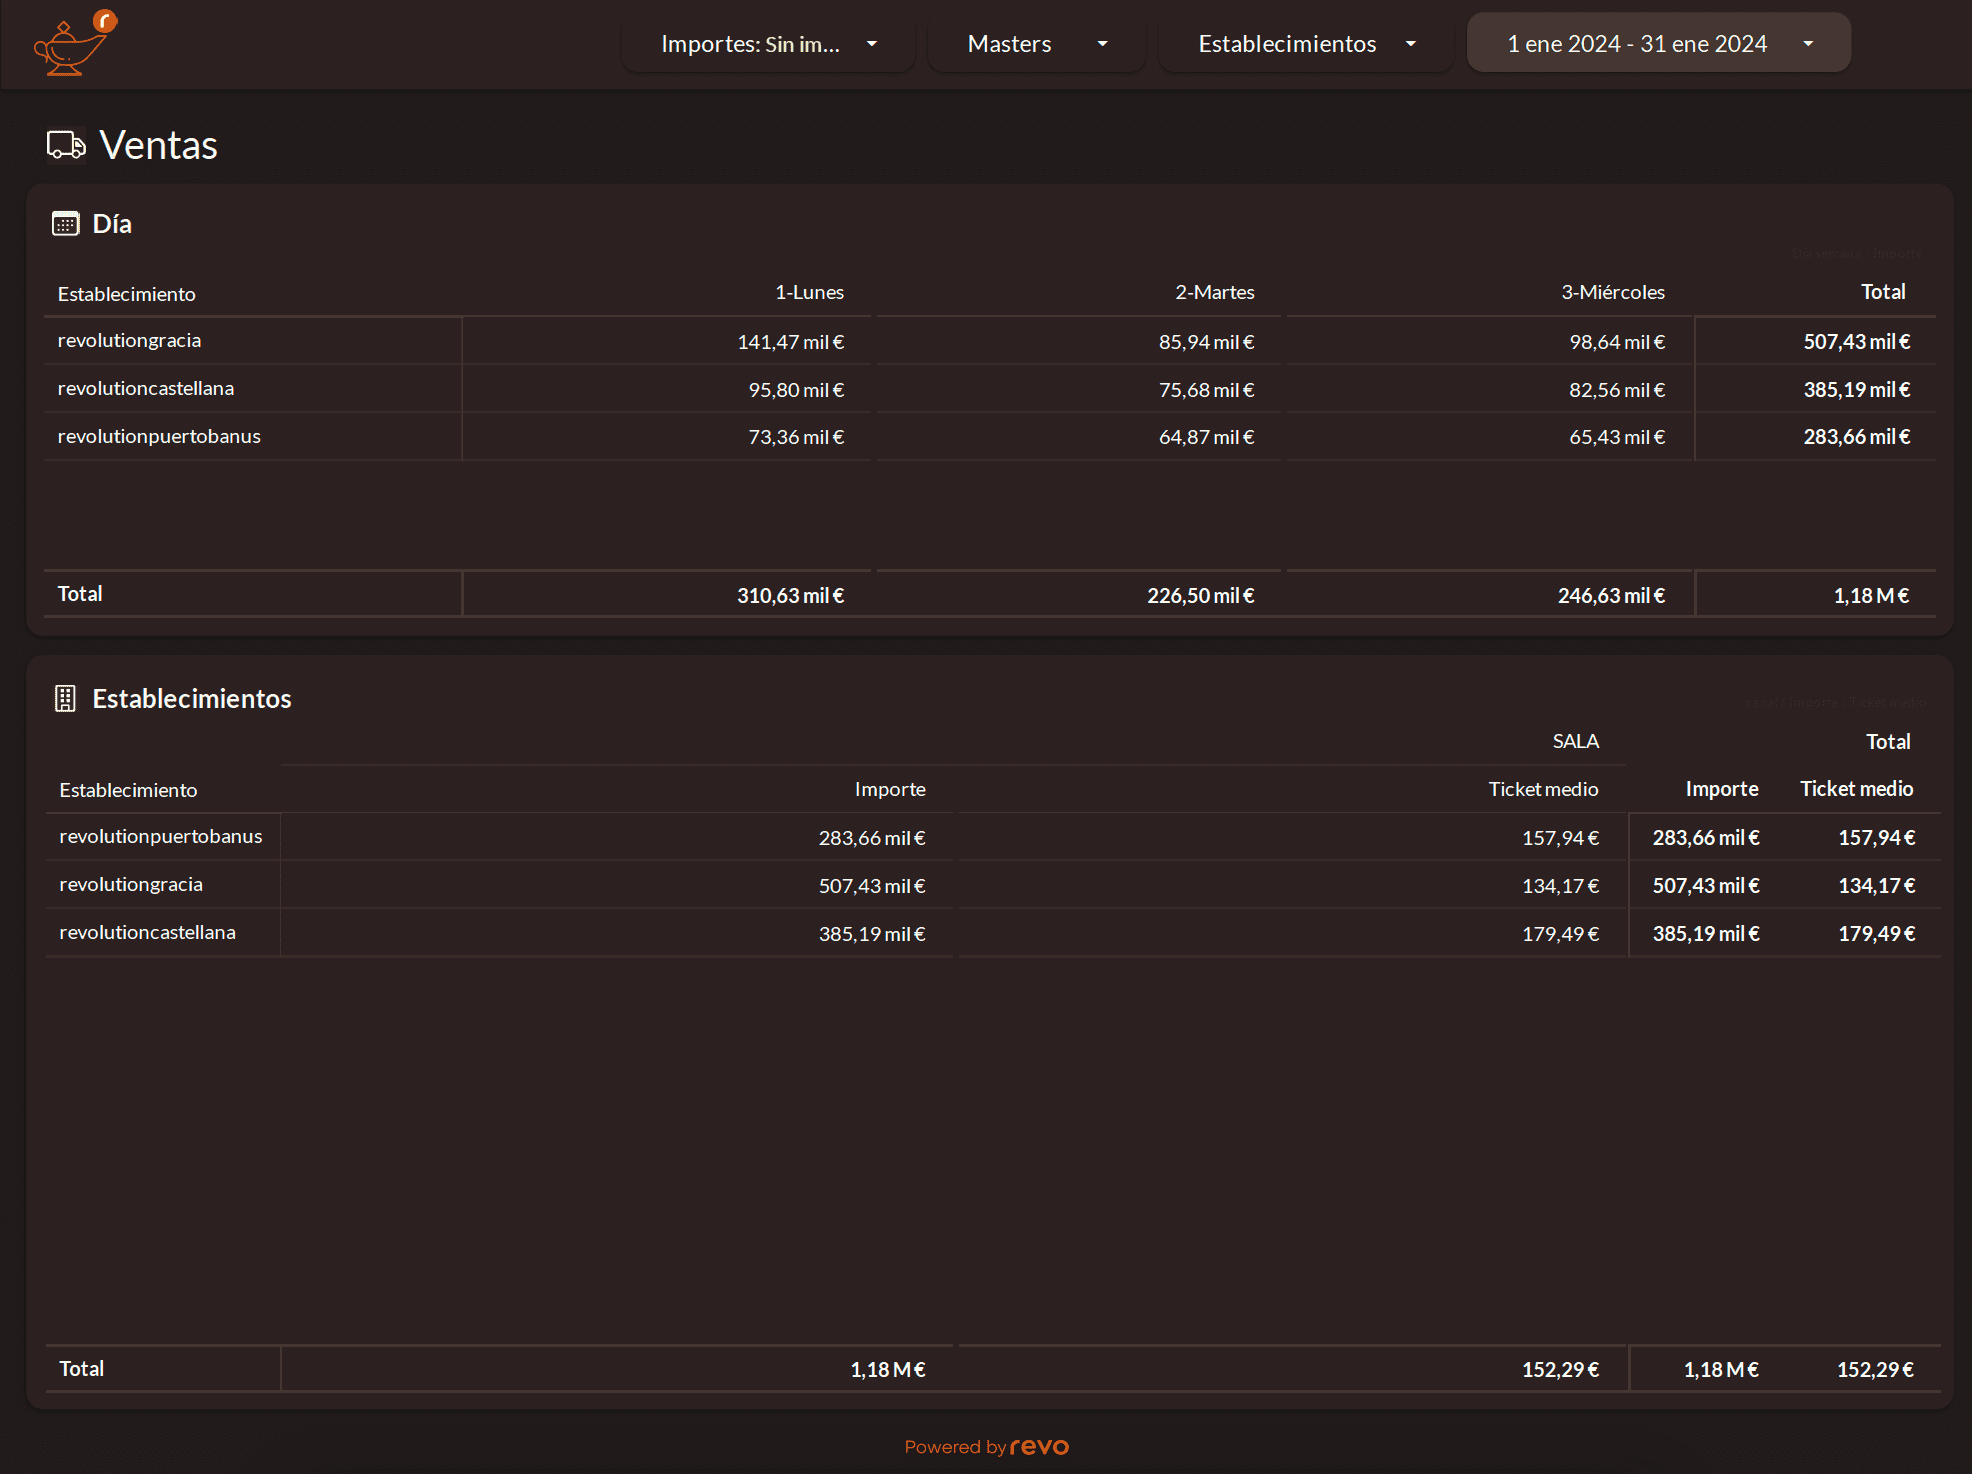
We have the following information detailed in the tables:
Day
- Establishment: It shows us the different establishments.
- Day: The different days appear with the amounts billed by deliveries.
- Total: The total billed appears.
Establishments
- Establishment: It shows us the different establishments.
- Amount: Total billed amount.
- Average ticket: Average value of the billed tickets.
